Background
Since 2014, my team at Middlebury has been using the “ELK” stack (Elasticsearch, Logstash, & Kibana) to aggregate and analyze our application, webserver, PHP, and CDN logs. Over the years I’ve built dashboards and visualizations that allow us to monitor application health and performance, drilling into problem areas and identifying errors before users report them to us. Being able to search and graph logs has been invaluable for fast troubleshooting when systems go offline.
While we began our ELK journey on a locally hosted system, several years ago we shifted to the managed ELK service from Logz.io as it was cheaper and much less hassle than self hosting the Elasticsearch database.
For our on-premises servers I now use FileBeat to ship log lines to Logz where they they get parsed on ingestion to live in the database as fielded data.
Logging on Pantheon
After 14 years of hosting our Drupal sites in our campus data center, we’re now shifting them to Pantheon hosting. In doing so, we need to update our logging mechanisms so that we don’t lose these powerful tools we’ve grown accustomed to.
Unlike our local data-center, Pantheon doesn’t allow us to install the FileBeat agent to manage log shipping, so we need to send logs directly to Logz from within the PHP process. Thankfully the Drupal Monolog module and the Monolog library make for a flexible logging framework that gets us 90% of the way there with just a few missing pieces.
While these modules & libraries support many log shipping mechanisms, they didn’t have support for Logz out of the box. To solve this, I wrote the tiny Drupal monolog_logz module which wraps the inpsyde/logzio-monolog library and allows you to configure it from within Drupal. With this library and glue module, we’re now shipping logs to Logz! If you are using a different aggregation service, this technique should be easy to copy to leverage a different shipping handler.
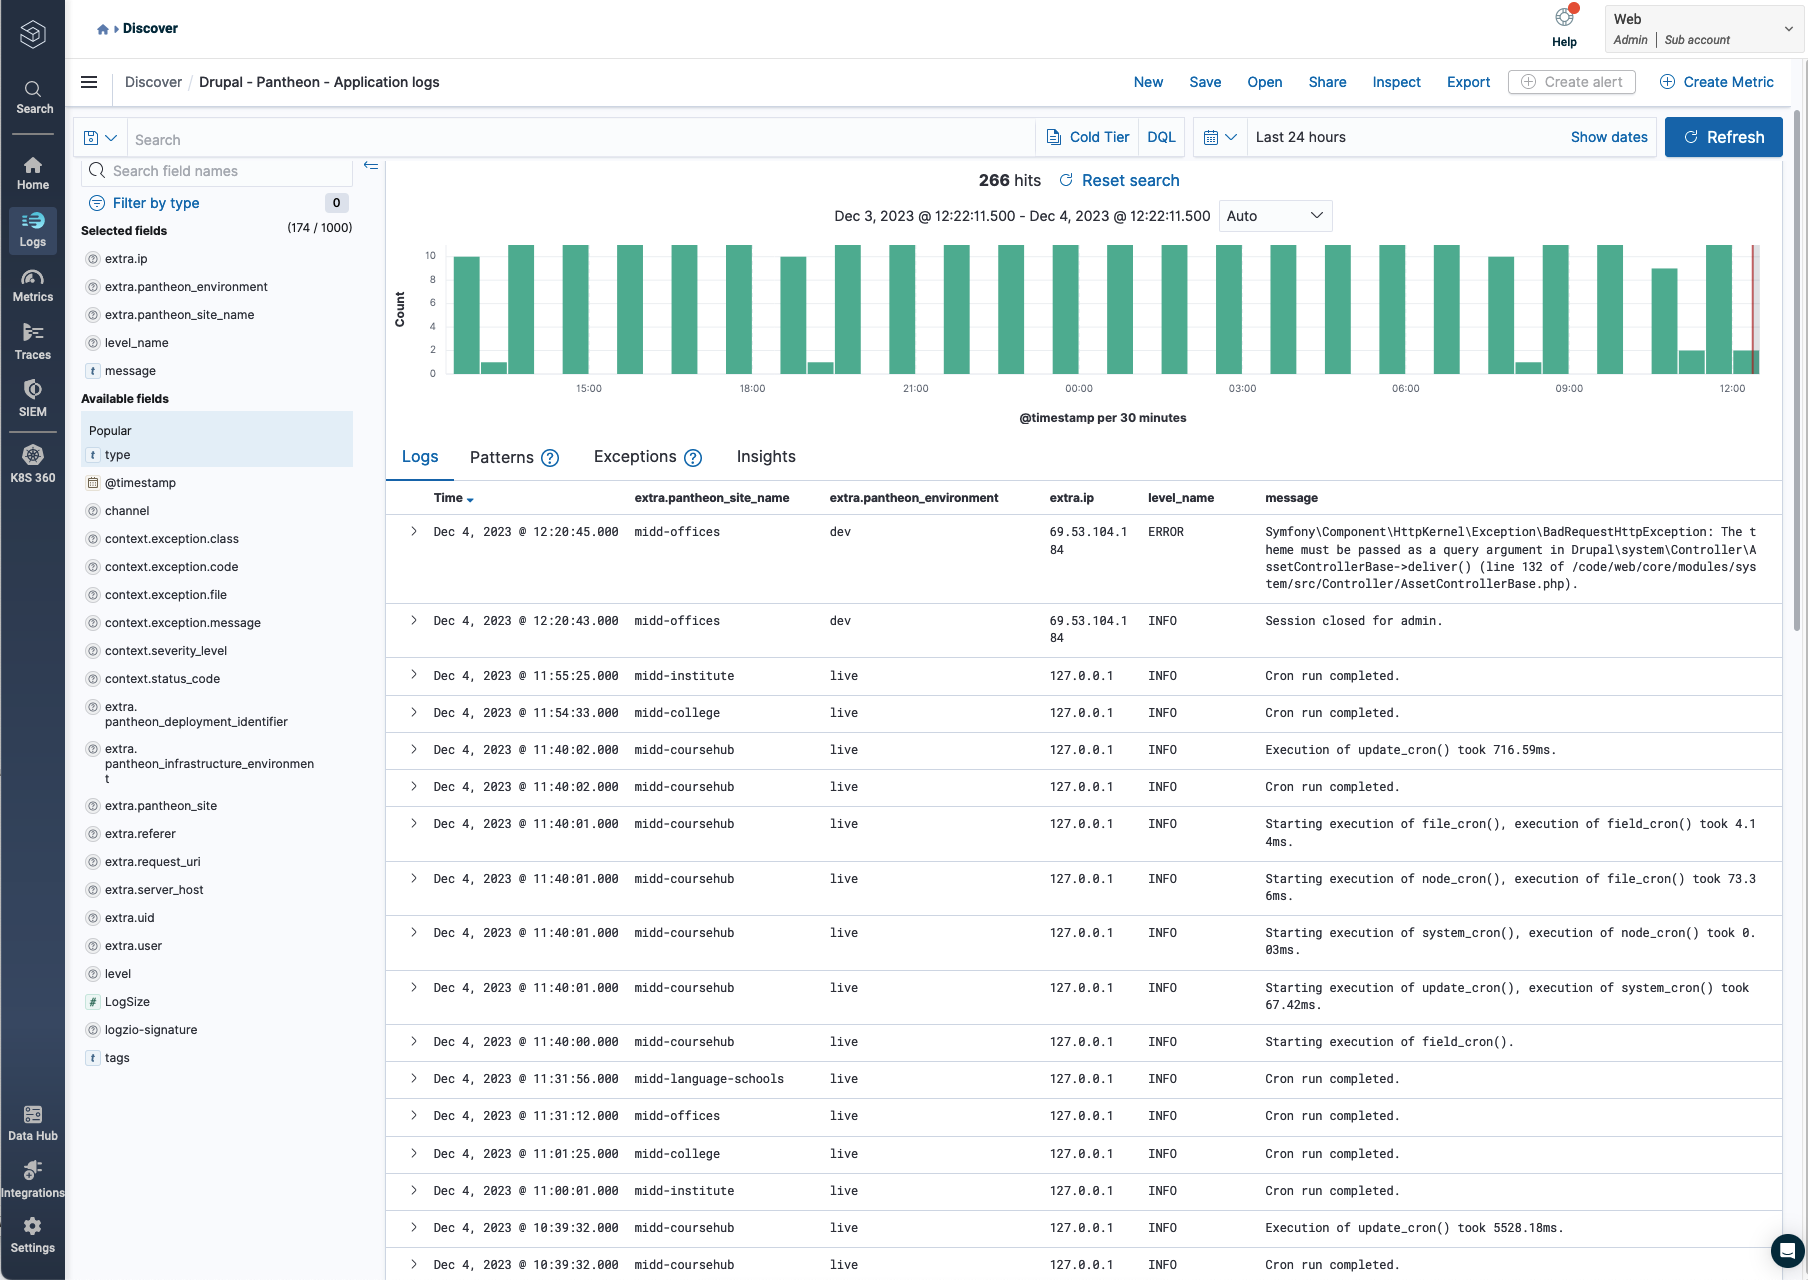
The next missing piece was to annotate log entries with information about the Pantheon environment. Our team manages about 20 Drupal sites and we need to be able to sort out which sites and environments (dev/test/live) the messages are coming from. A mechanism didn’t exist, so I wrote a little 1-file library middlebury/monolog-pantheon which injects some important environmental details into the log entries before they get shipped off to Logz:
extra.pantheon_site_nameextra.pantheon_siteextra.pantheon_environmentextra.pantheon_infrastructure_environmentextra.pantheon_deployment_identifier
Putting it together
First install the modules and libraries in your Drupal site and enable the Drupal modules:
composer require drupal/monolog
composer require drupal/monolog_logz
composer require middlebury/monolog-pantheon
drush pm-enable monolog monolog_logz
Next, add the monolog configuration file and your Logz account information to your settings.php:
# sites/default/settings.php

$settings['container_yamls'][] = __DIR__ . '/monolog.services.yml';

$config['monolog_logz.settings']['token'] = 'my-logzio-token';
$config['monolog_logz.settings']['type'] = 'drupal';
$config['monolog_logz.settings']['host'] = 'EastUs1';
$config['monolog_logz.settings']['level'] = 'Debug';
Note that you may wish to inject your token into your configuration via Pantheon’s secrets system, but that is a separate exercise.
Add a file to configure the Monolog module and tell it about our Logz shipping handler and our Pantheon processor :
# sites/default/monolog.services.yml

parameters:
  monolog.logger.processors: ['pantheon']
  monolog.channel_handlers:
    php: ['error_log', 'logz']
    default: ['logz']

services:
   monolog.processor.pantheon:
     class: Middlebury\MonologPantheon\Processor\PantheonProcessor
Once this configuration is in place in your Pantheon environments you should start seeing log entries populating your Logz account.
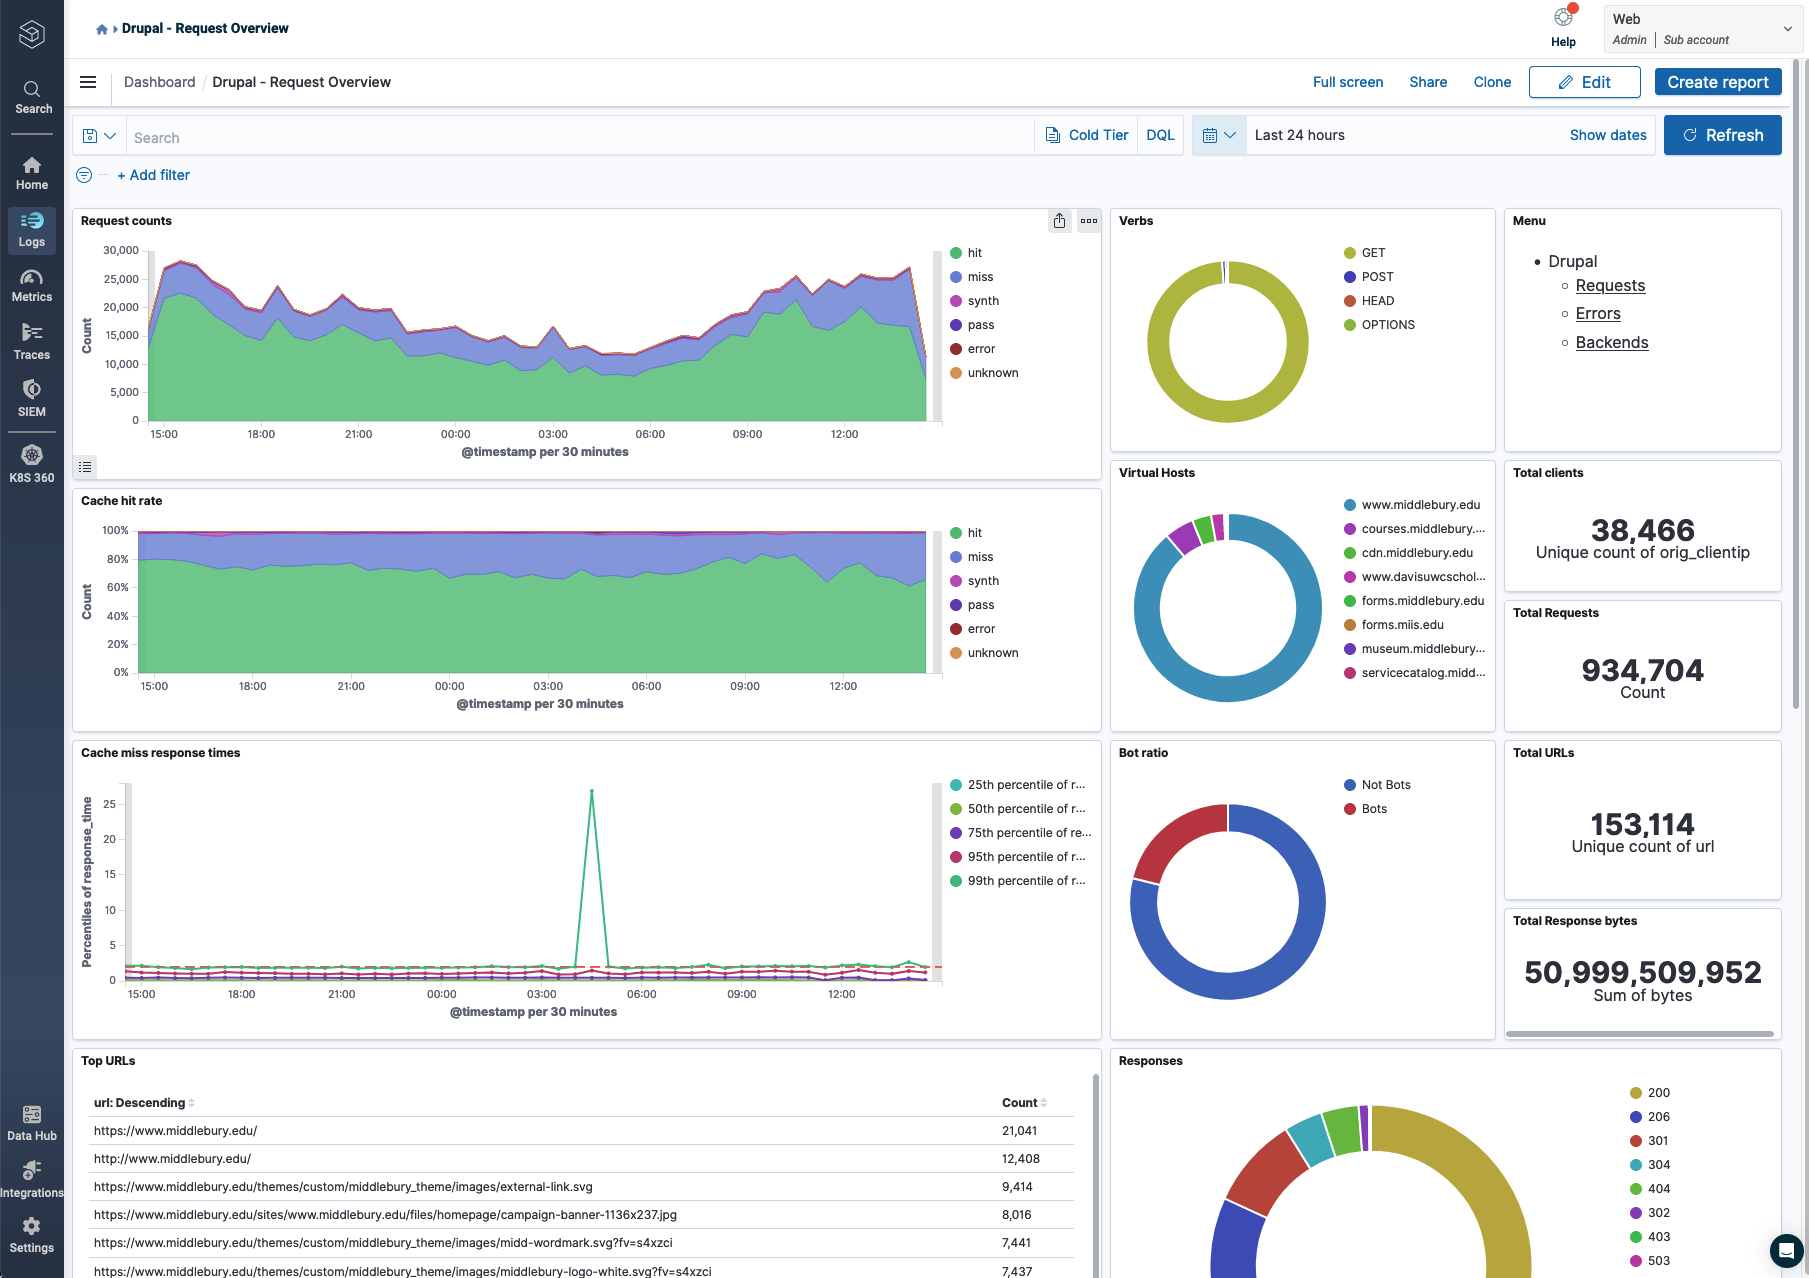
From there you can build out visualizations and dashboards to mine the log data for unexpected errors and other operational issues.