In recent years, nordic ice skaters have been using the Sentinel 2 satellite imagery that is captured every few days to remotely scout for fresh ice that isn’t covered with snow. This has been a fabulous tool for identifying conditions before heading out on the ice.
Have you ever been out on the lake and wished that you could see where you were in relation to the pressure ridge you saw in yesterday’s satellite imagery?
Using the OsmAnd app and the instructions below, you can see your real-time position overlaying recent satellite imagery while you are exploring the ice.
Setting up Copernicus configurations
While the Copernicus Browser lets you browse and see satellite imagery, in order to get a tile-set with parameters you choose, you’ll need to create an account and a data configuration within the Copernicus utility.
Step 1: Create a Copernicus account
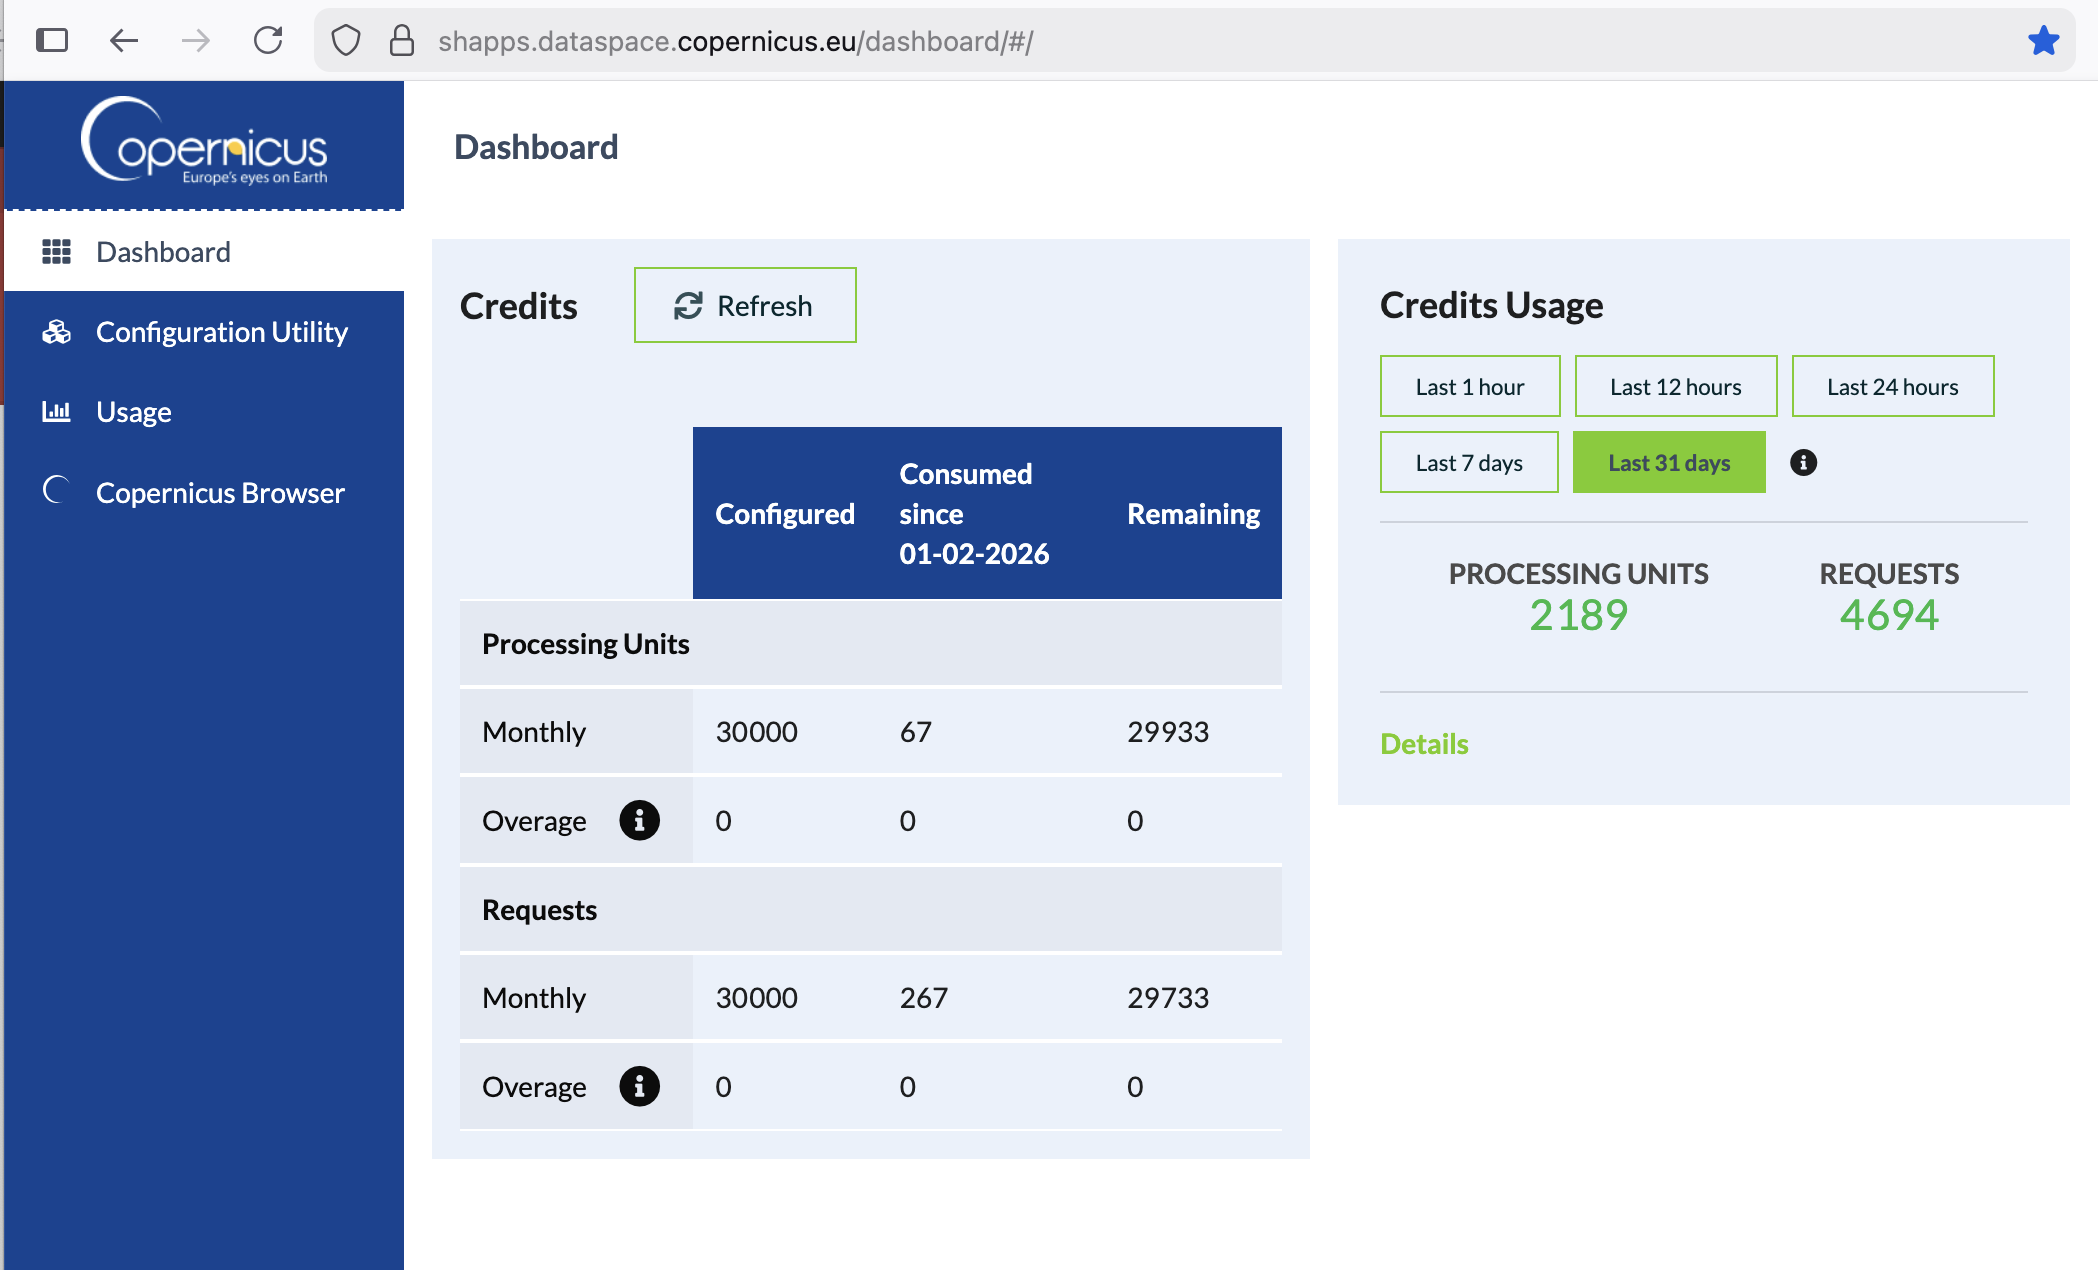
Head to https://shapps.dataspace.copernicus.eu/dashboard/ and register an account if you don’t already have one.
Each account is given a reasonable quota of “processing units” and requests that are more than sufficient for individual use, but not necessarily sufficient for sharing across many users. When you are logged in you will see your quota usage on your Dashboard.
Step 2: Create one or more “configurations” of data you want to display
The Copernicus system allows you to create “configurations” that select certain data to display as tiles. These configurations define which data set you wish to select and what time/cloud-cover filters to use in selecting images.
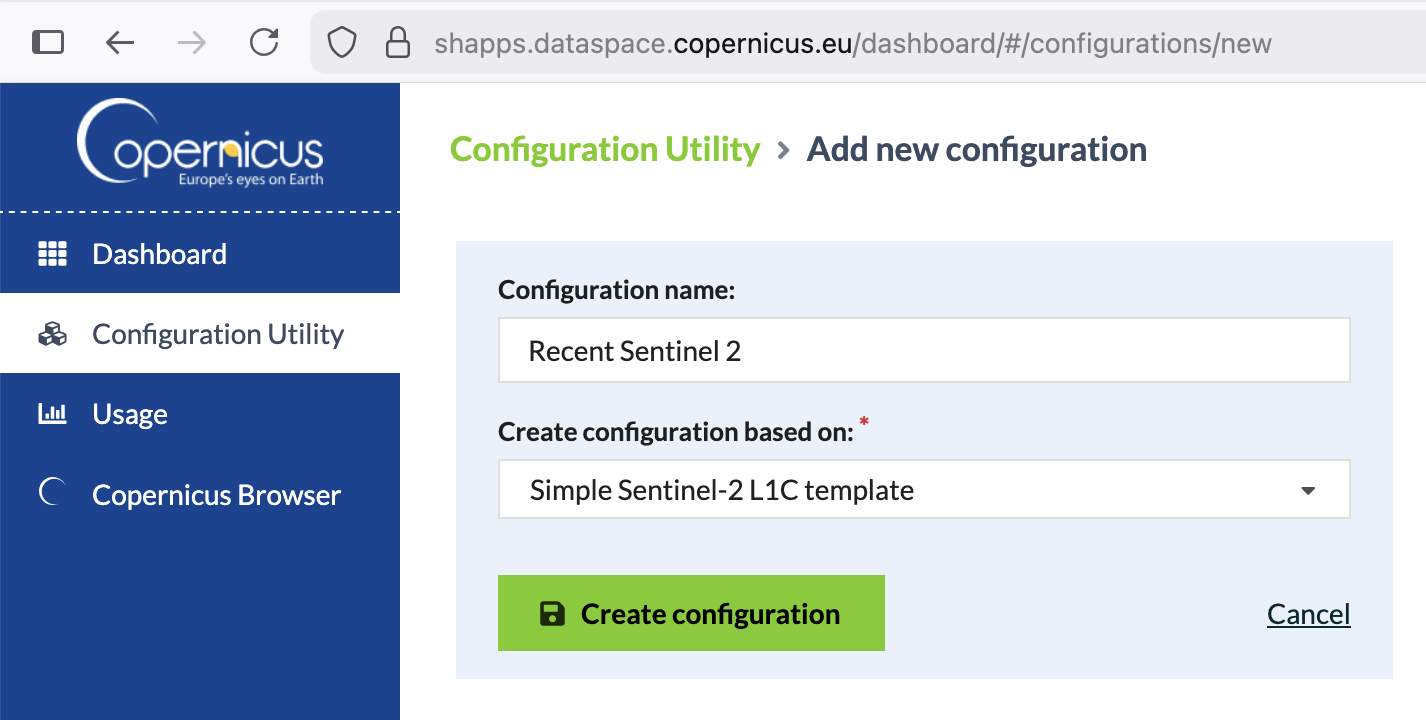
Go to the Configuration Utility (found in the left sidebar navigation) and click the + New configuration button.
Name your new layer and choose the Simple Sentinel-2 L1C template:
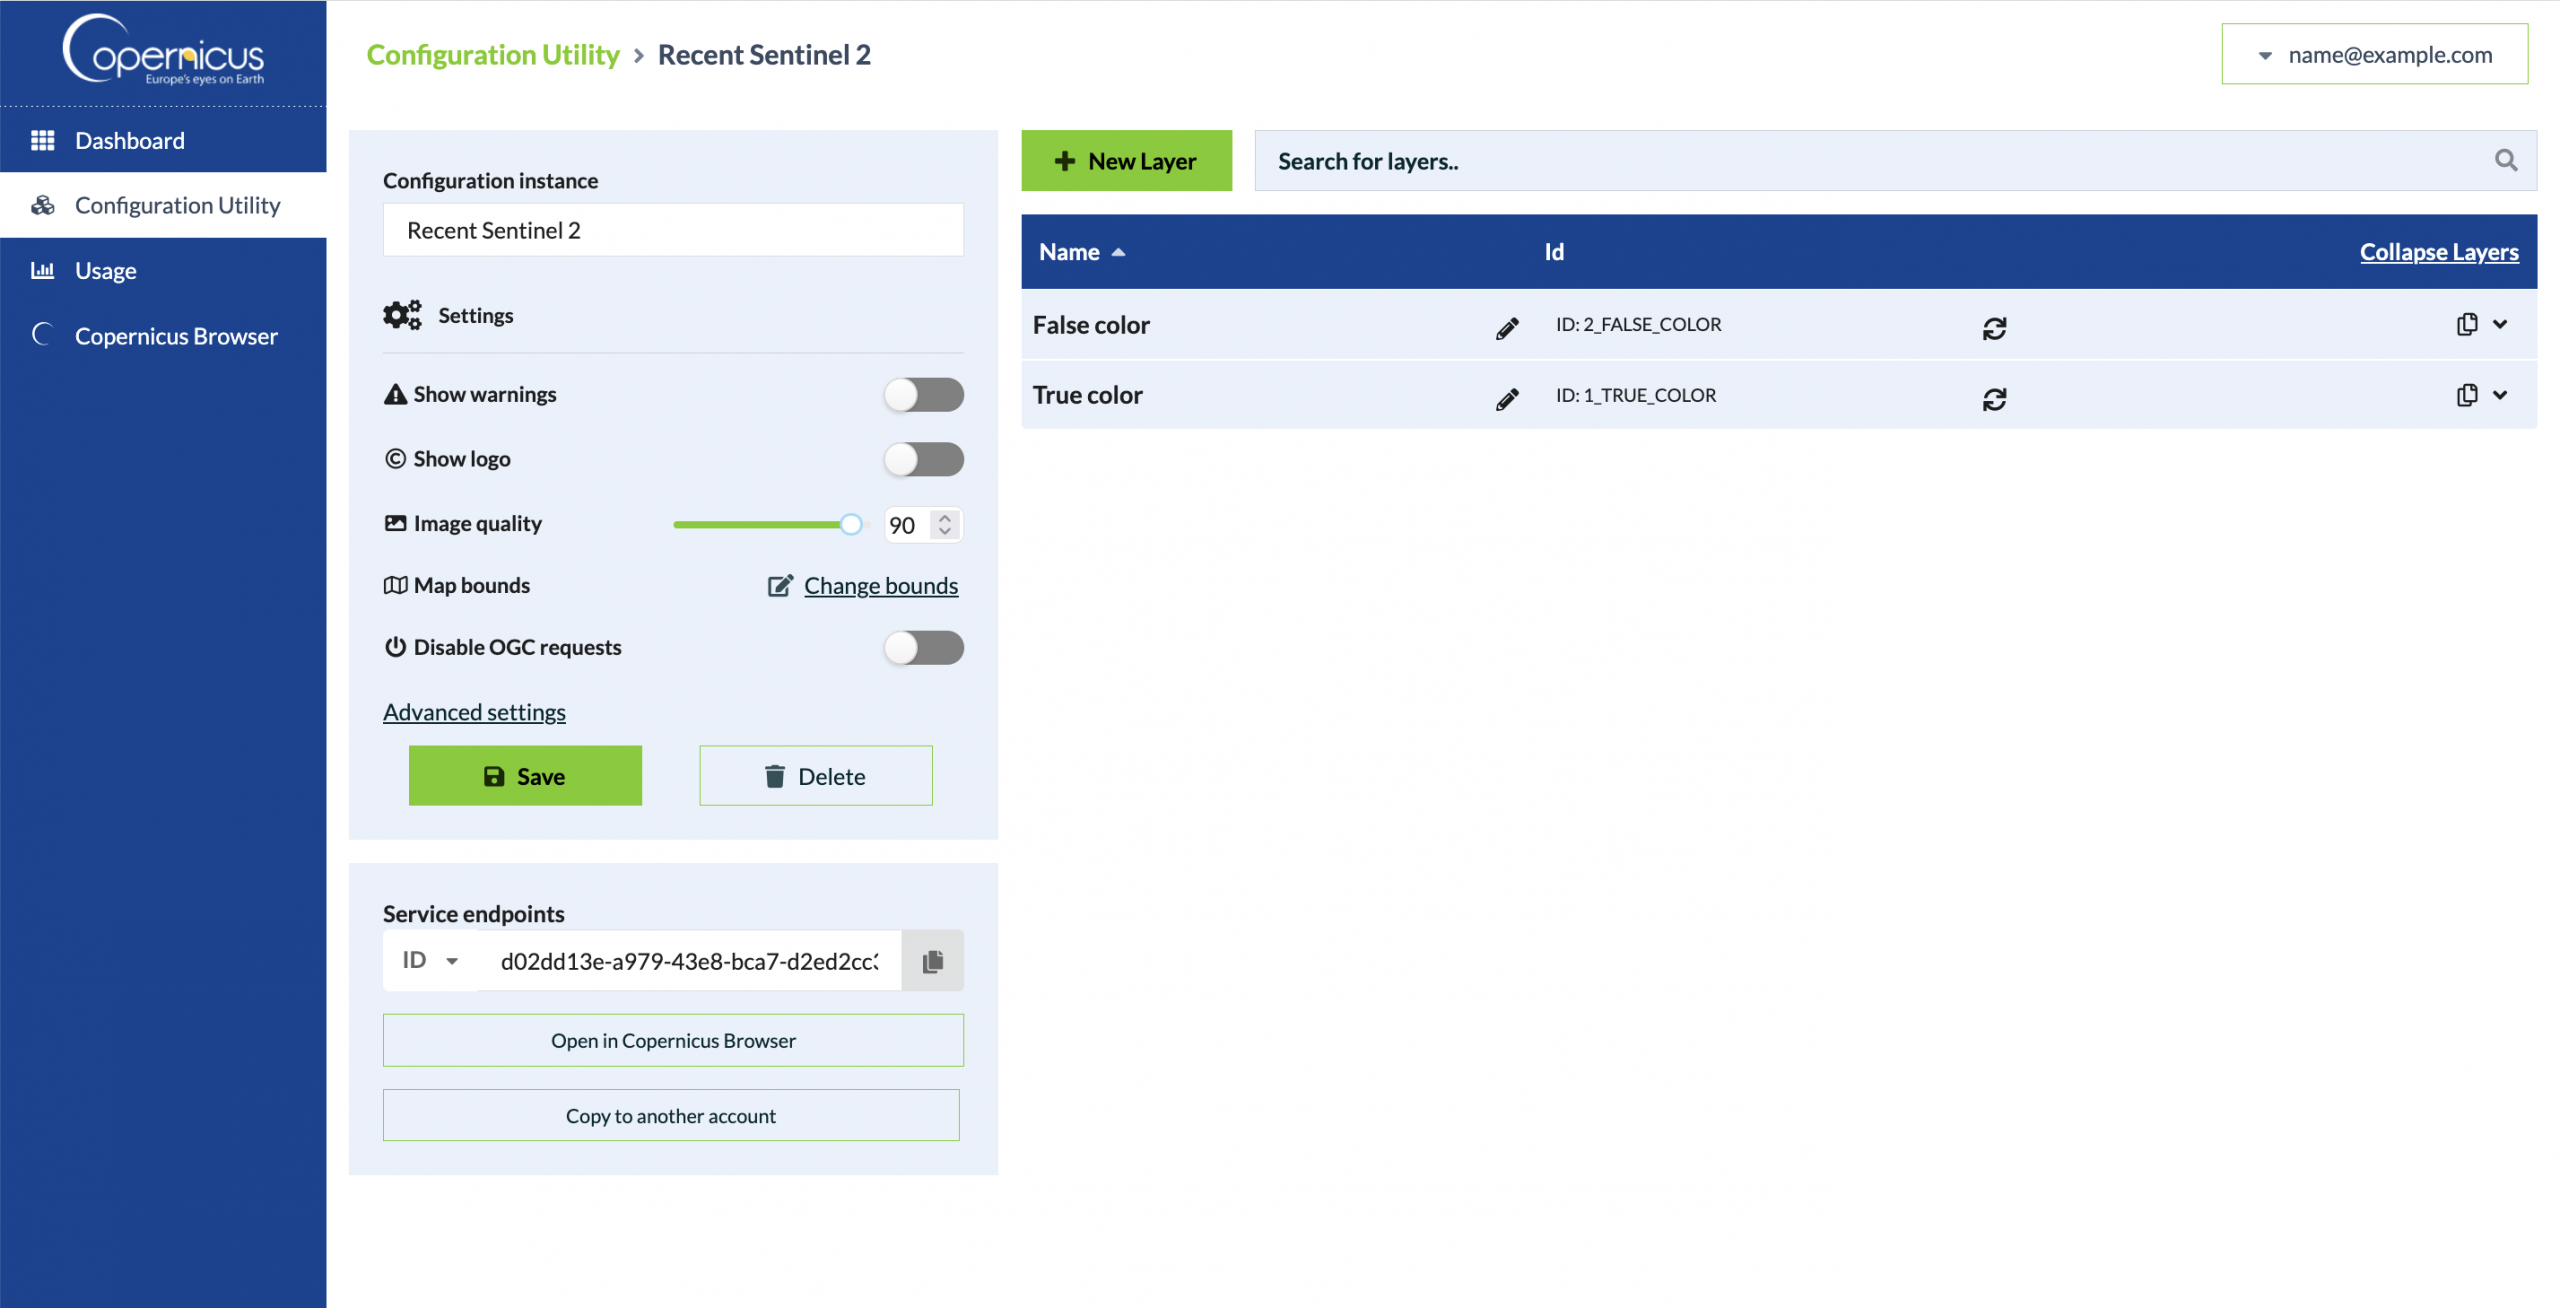
Below is the configuration you’ll see from this template:
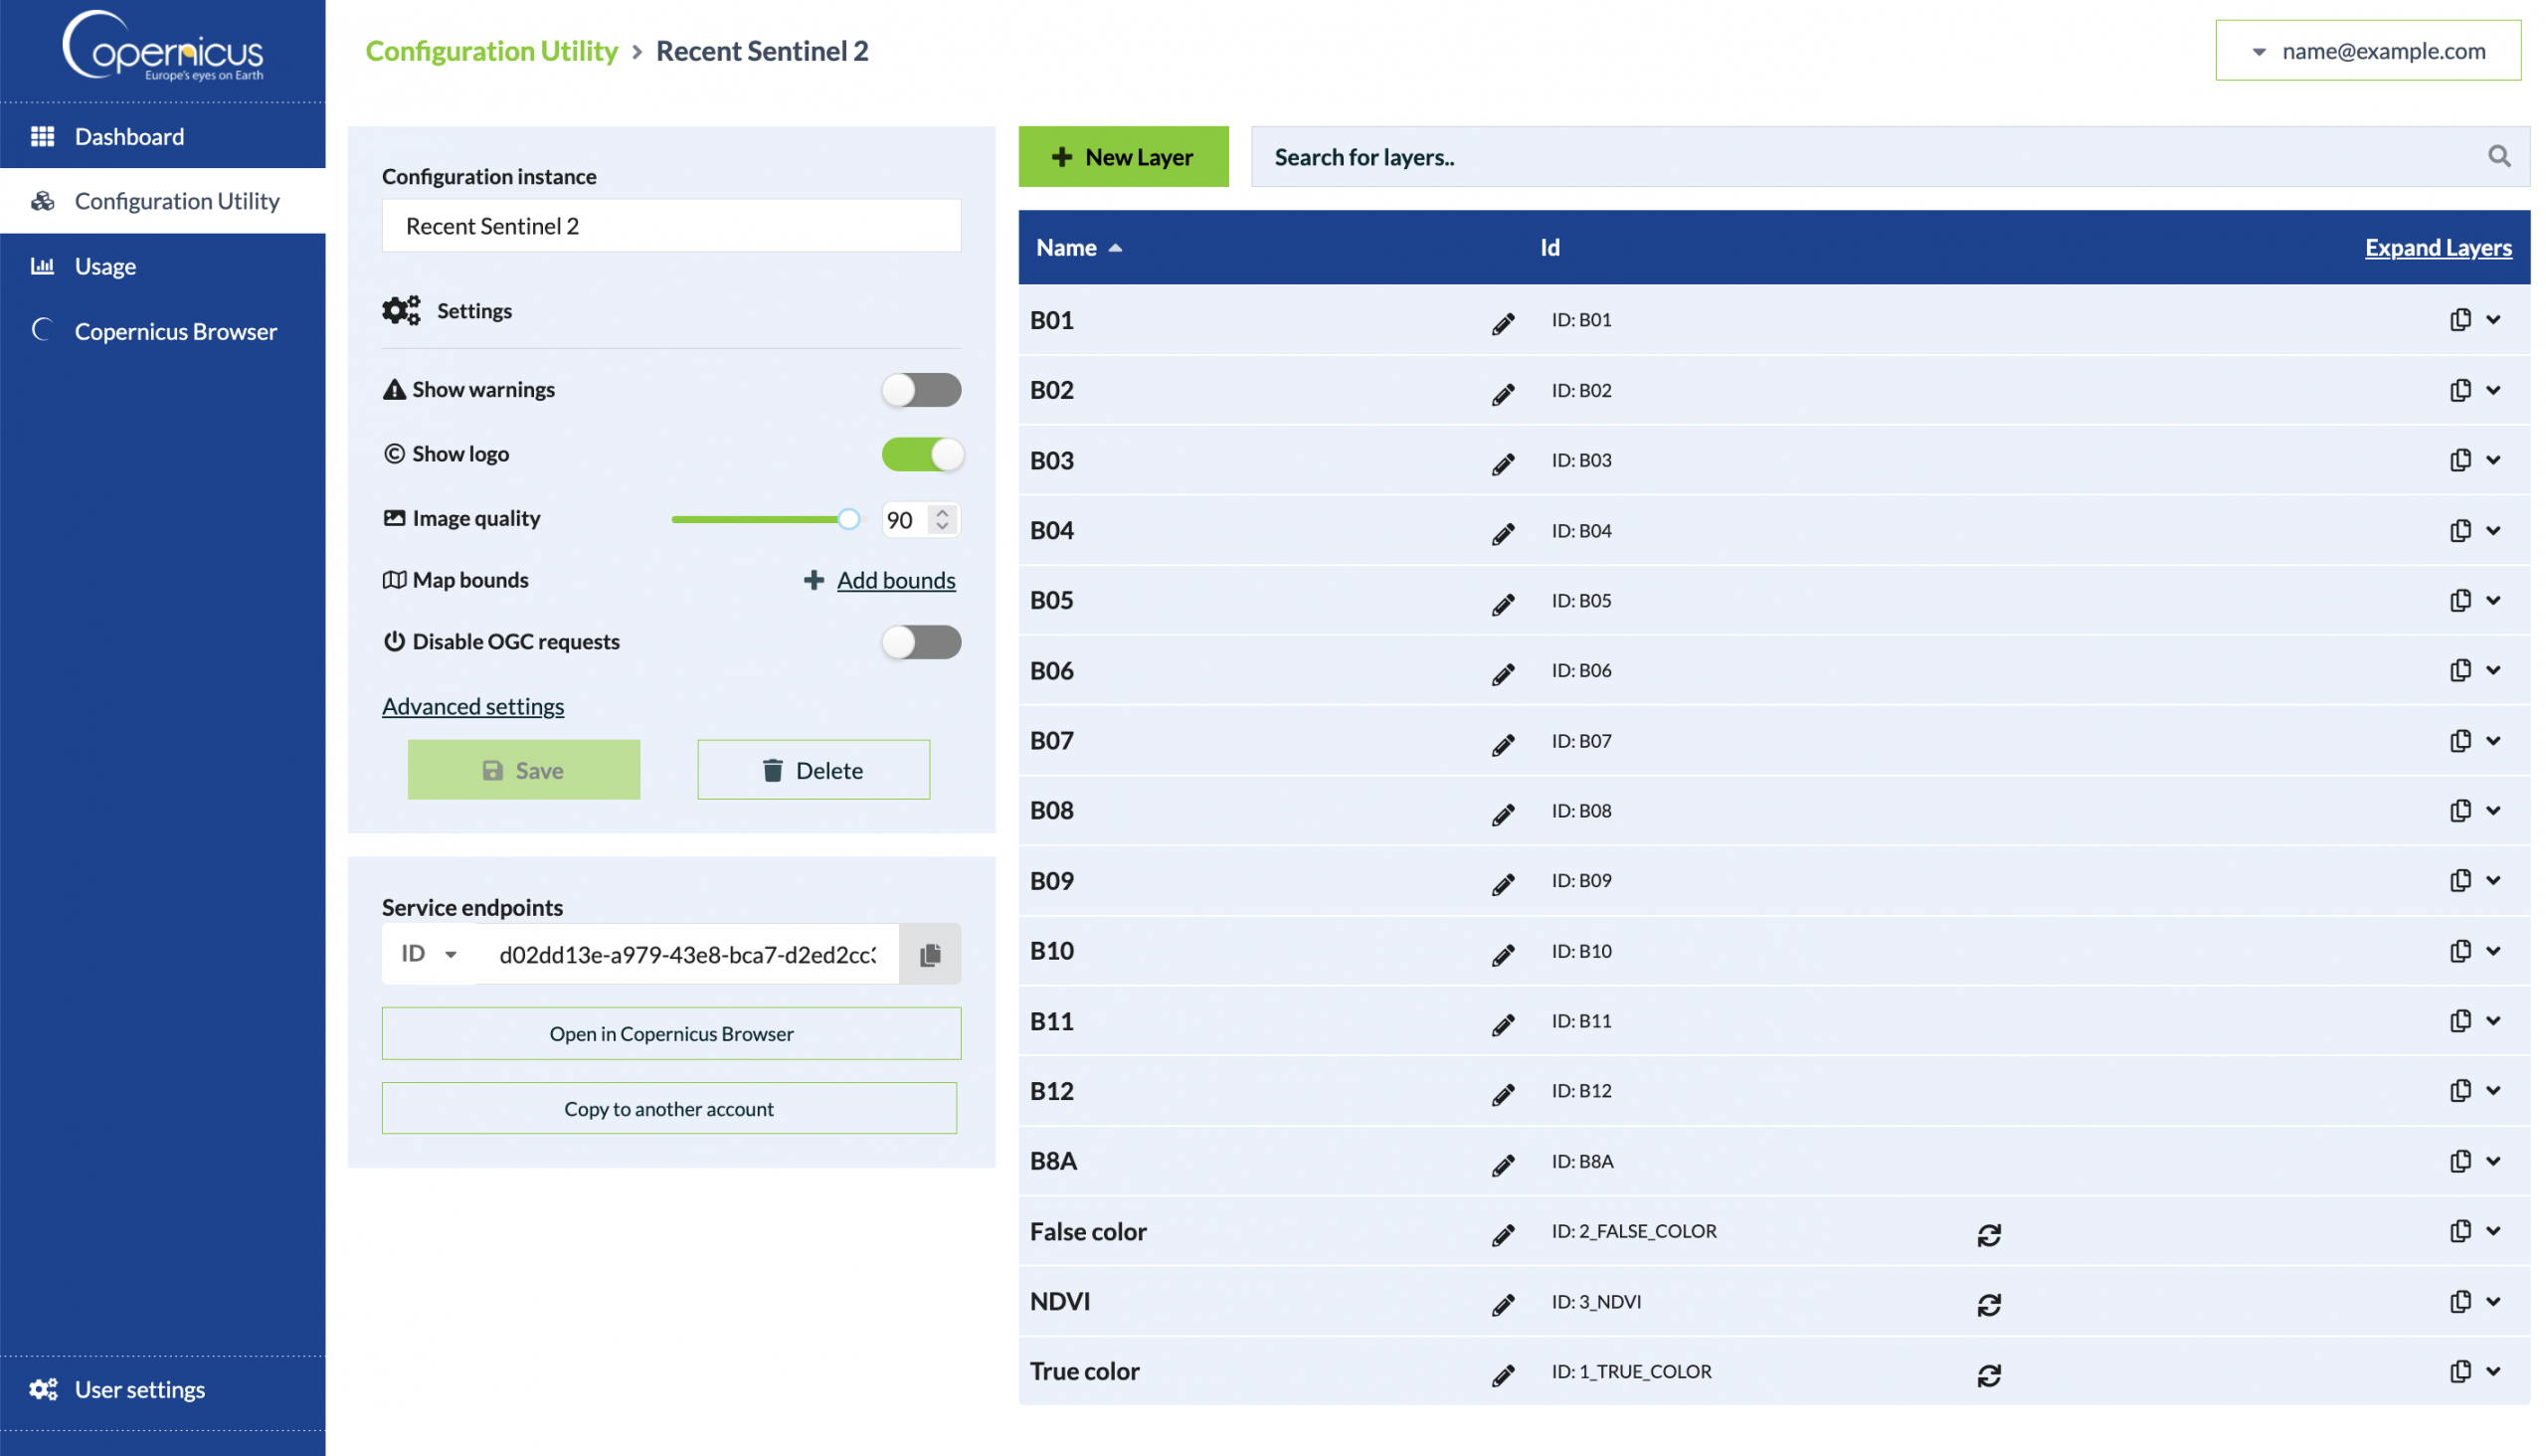
Under the settings I chose to:
- Optional: turn Show logo off
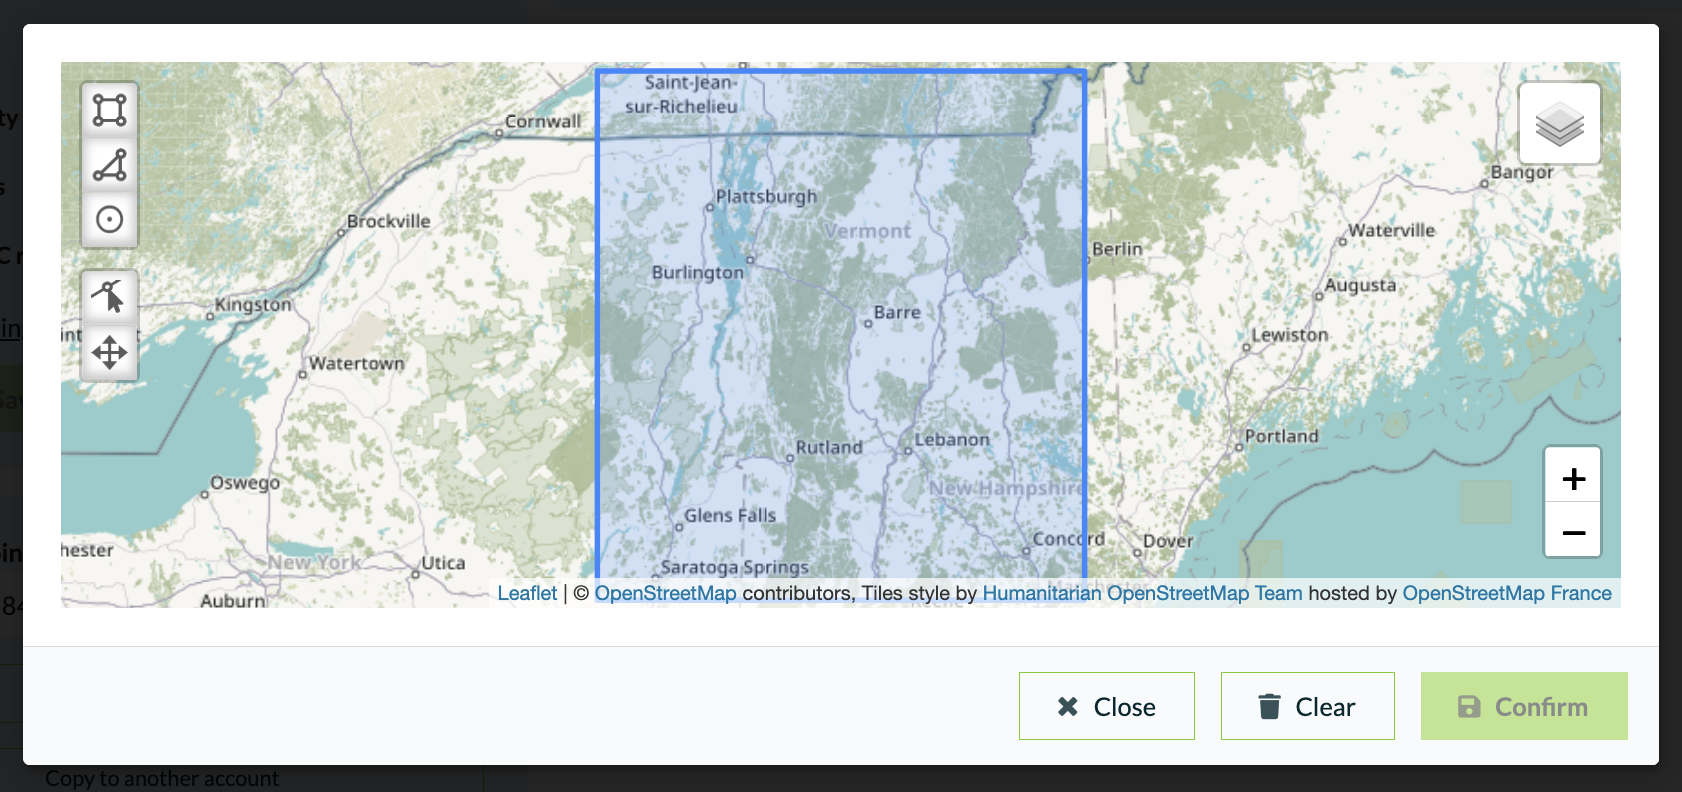
- Optional: Change the Map bounds to just my region to avoid loading tiles when viewing to other parts of the world. This may not be needed, but I didn’t want to accidentally rack up lots of quota usage when browsing around.
Step 3: Choose the layers you might want to view
The layers were interest in are the False color and True Color layers, we can delete all of the other layers if we desire, or just ignore them. I chose to delete them:
Step 4: Configure the layer settings
Now we have our configuration basically set up and we can explore the settings for choosing mosaic tiles. The defaults will select captures where there is very little cloud cover (20% or less).
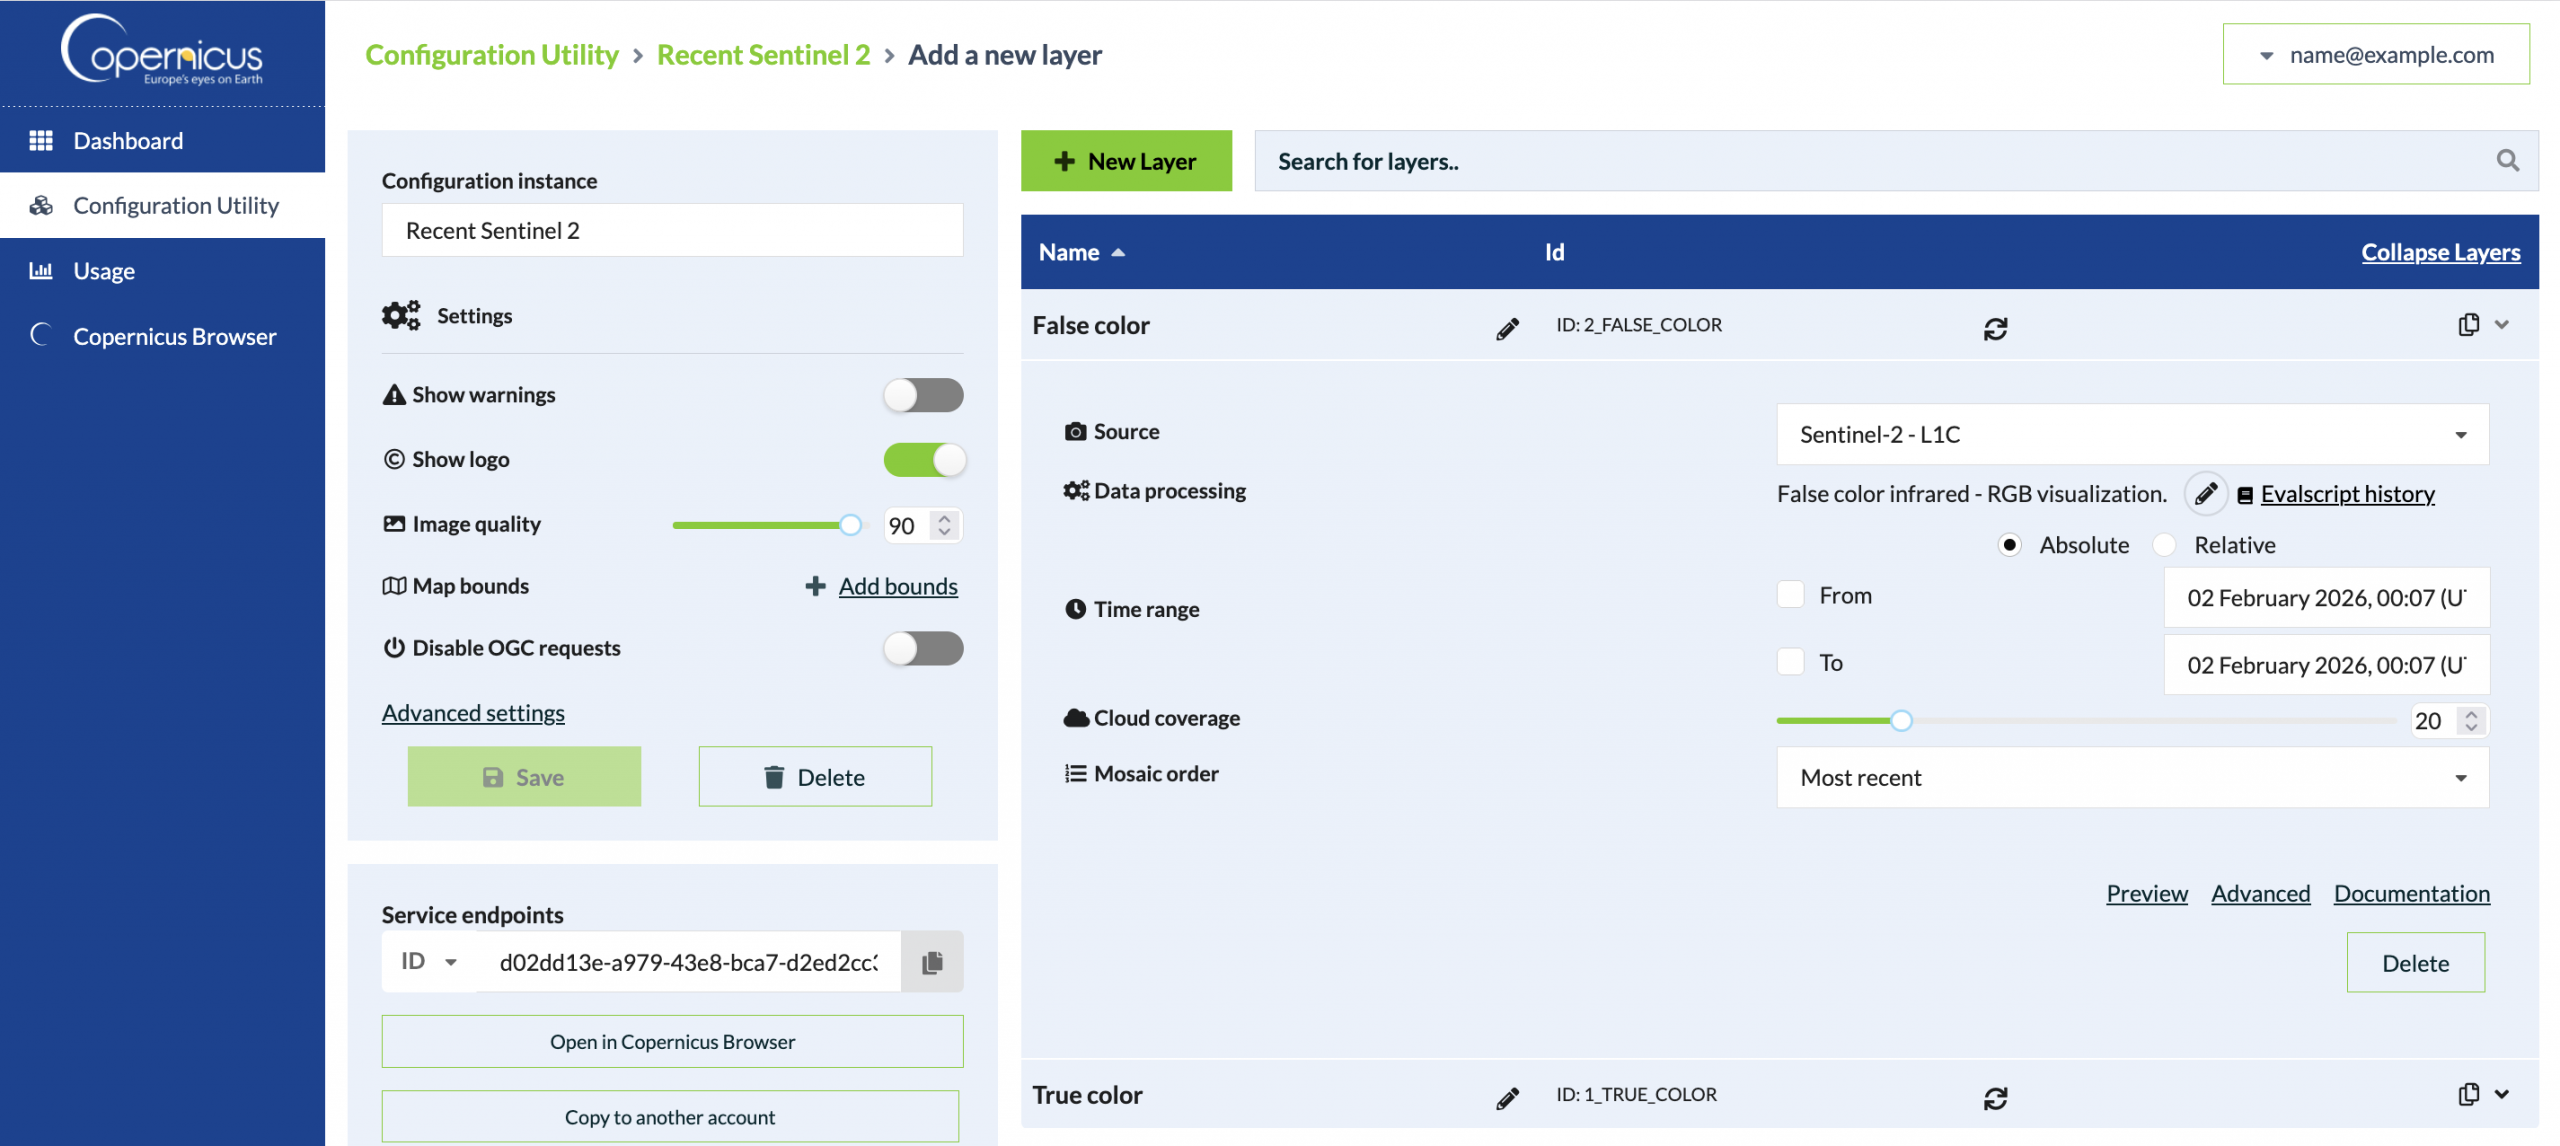
For on-ice navigation, we probably want recent imagery (~10 days old or less) and can be OK with lots of cloud cover if the spot we are skating happens to be clear.
I changed my layer settings to use a Relative time range From: -1 Week from today and a Cloud coverage of 75% or less, with the Most Recent capture selected that meets these criteria:
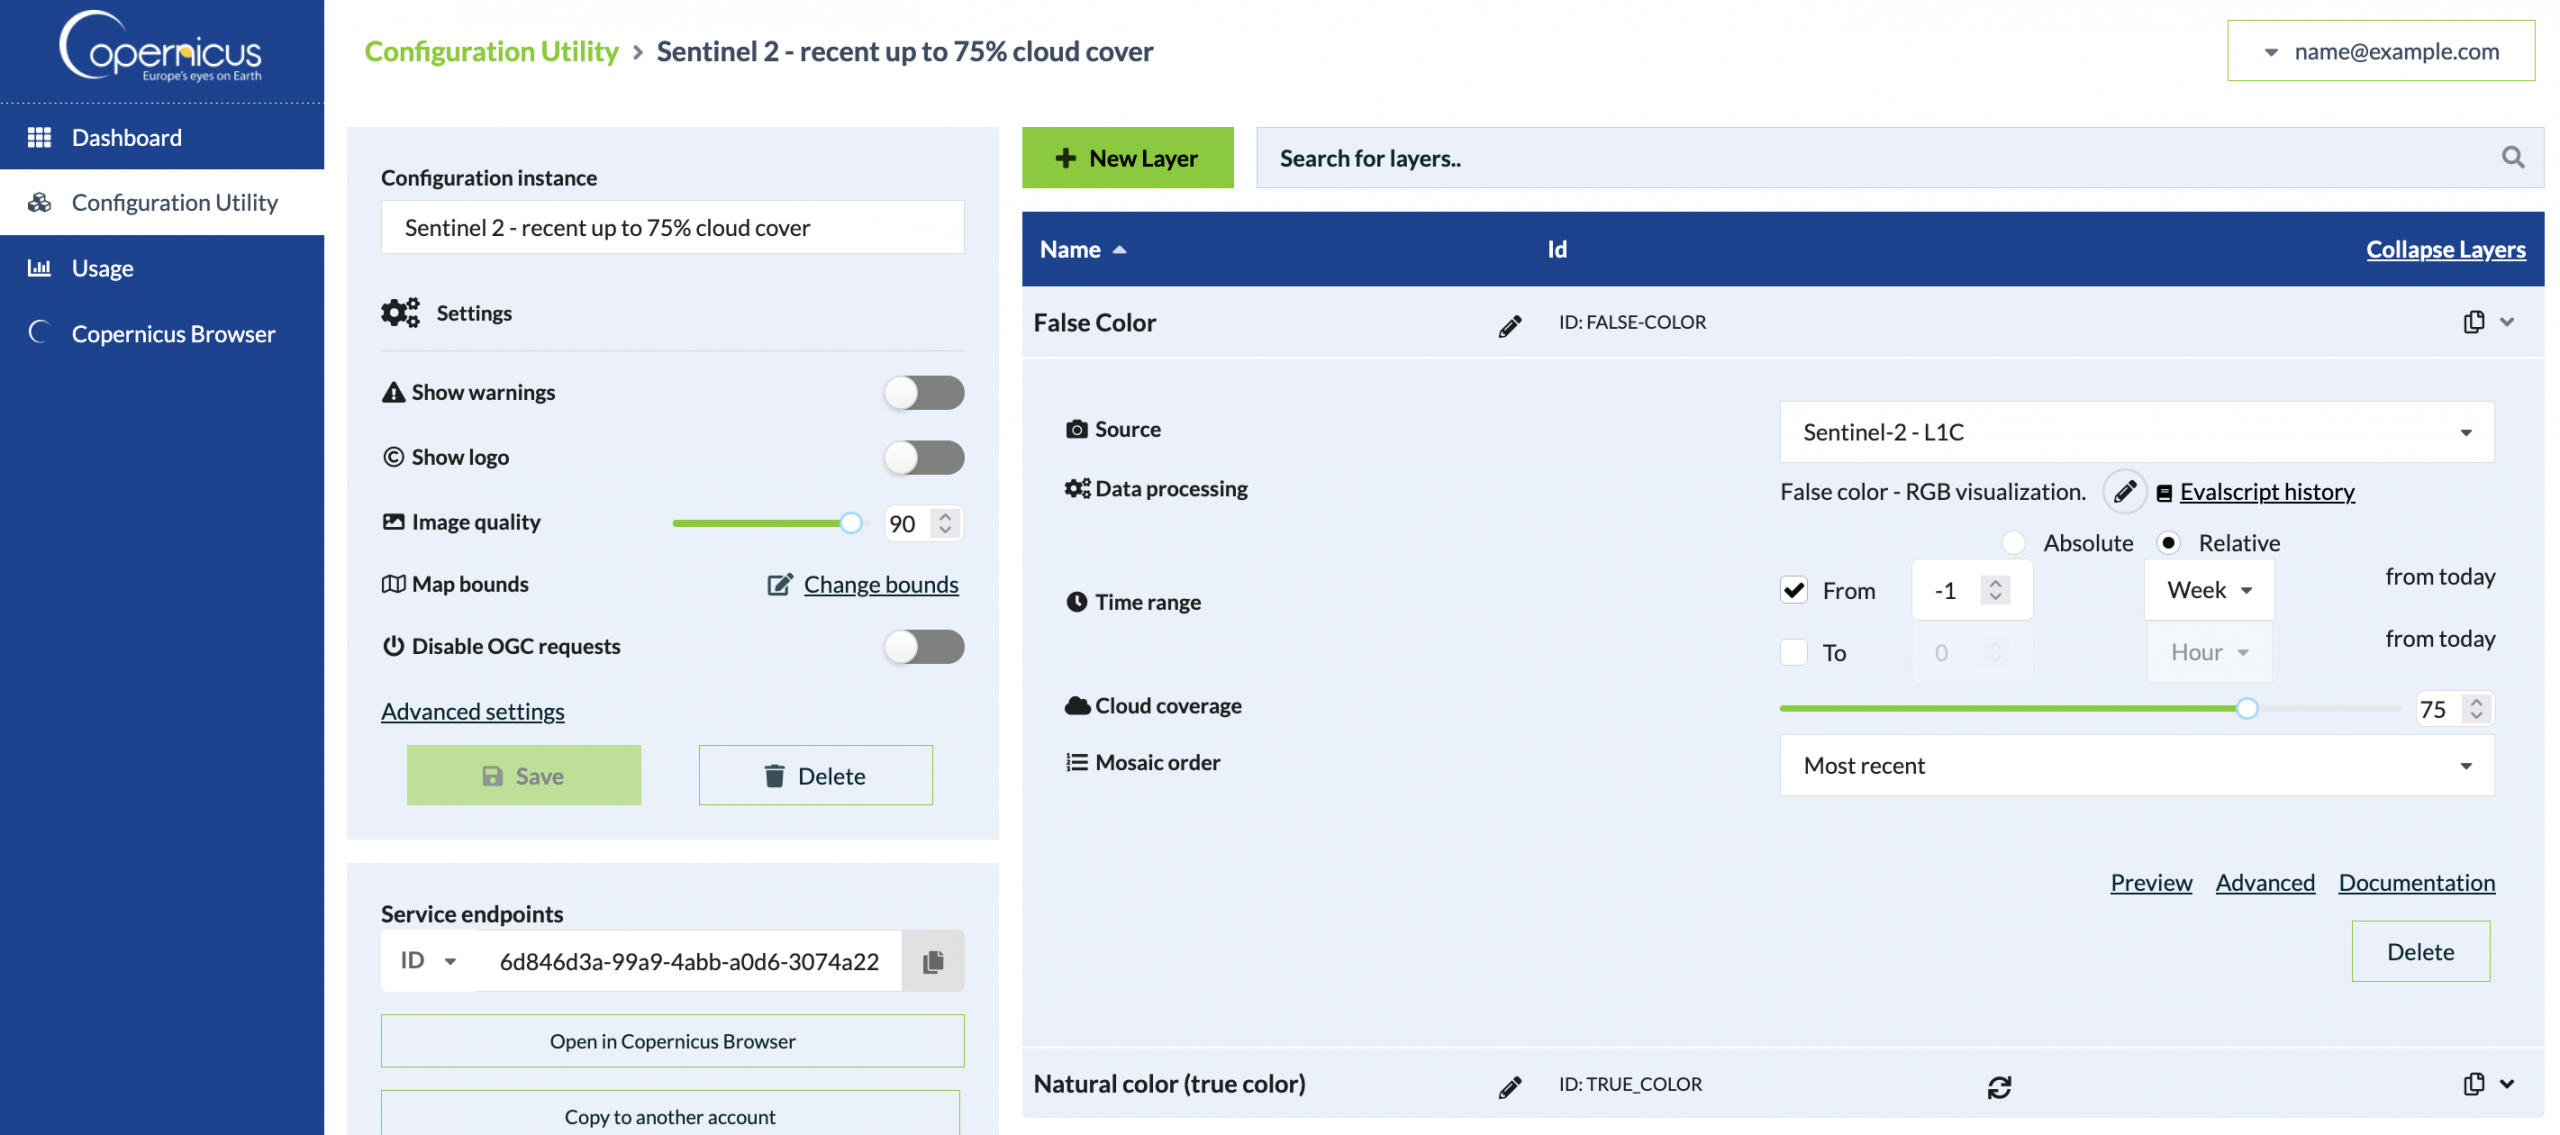
You can tweak these values to meet your own desires. For example, I also created an additional layer that would select the capture with the least cloud coverage over the past 10 days. You can have as many layers as you desire.
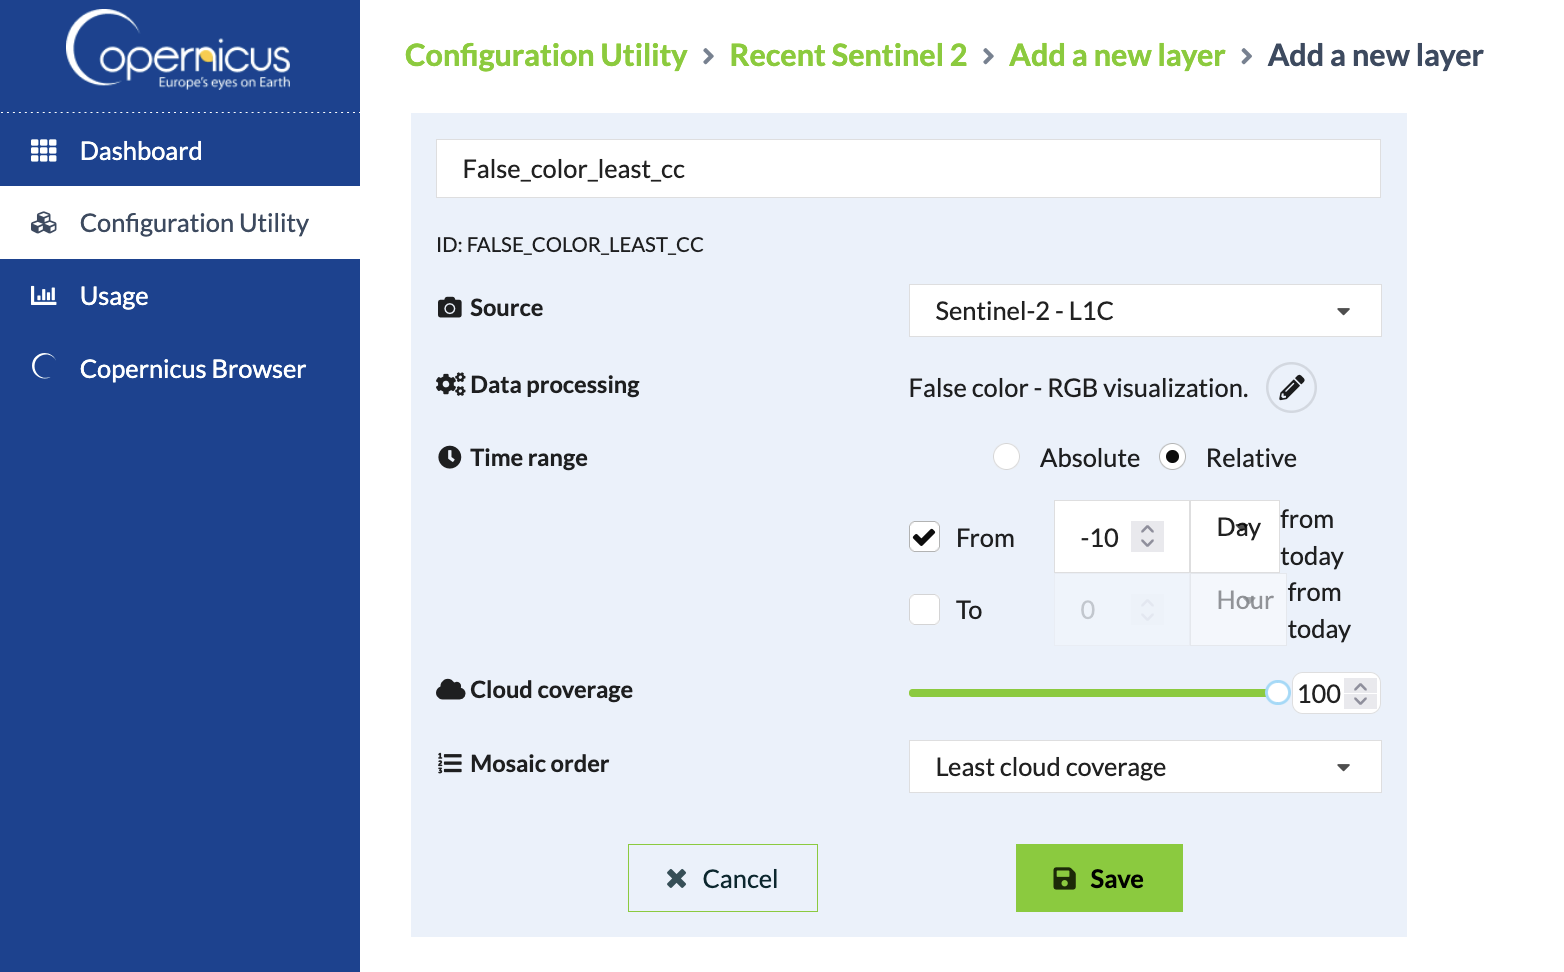
Step 5: Note your service endpoint and layer IDs
Once your layer changes are saved, take note of your service endpoint ID and your layer IDs. You will need these later to build URLs for display in OsmAnd. Mine looked like:
- Service endpoint: d02dd13e-a979-43e8-bca7-d2ed2cc37a08
- Layer IDs:
- 1_TRUE_COLOR
- 2_FALSE_COLOR
- FALSE_COLOR_LEAST_CC
You can also find your new layers in the Copernicus Browser by looking for your Configuration at the bottom of the Configuration drop-down. Once you click a recent date, you should see your layers and the mosaics picked — it’s a little confusing to identify what actual date is shown though.
Displaying the imagery in OsmAnd
Step 1: Download and install OsmAnd
Go to https://osmand.net/ and install on your phone. OsmAnd is a great application that is especially effective for hiking/biking and on-trail navigation. All navigation and data is offline and doesn’t require you to have mobile service. It also does car navigation and even can navigate waterways and ski trails. I find it really shines in the outdoor context with hill-shade and contour lines enabled. It is a somewhat complex app though, so don’t be discouraged by the learning curve. With that complexity comes a ton of features.
The free “Start” version of OsmAnd is sufficient to get started, but the Maps+ edition with hill-shade, contour lines, and unlimited map downloads really shines.
All of the data in OsmAnd comes from OpenStreetMap, a collaboratively built map of the world that you can contribute to if you find something is missing.
Step 2: Enable plugins
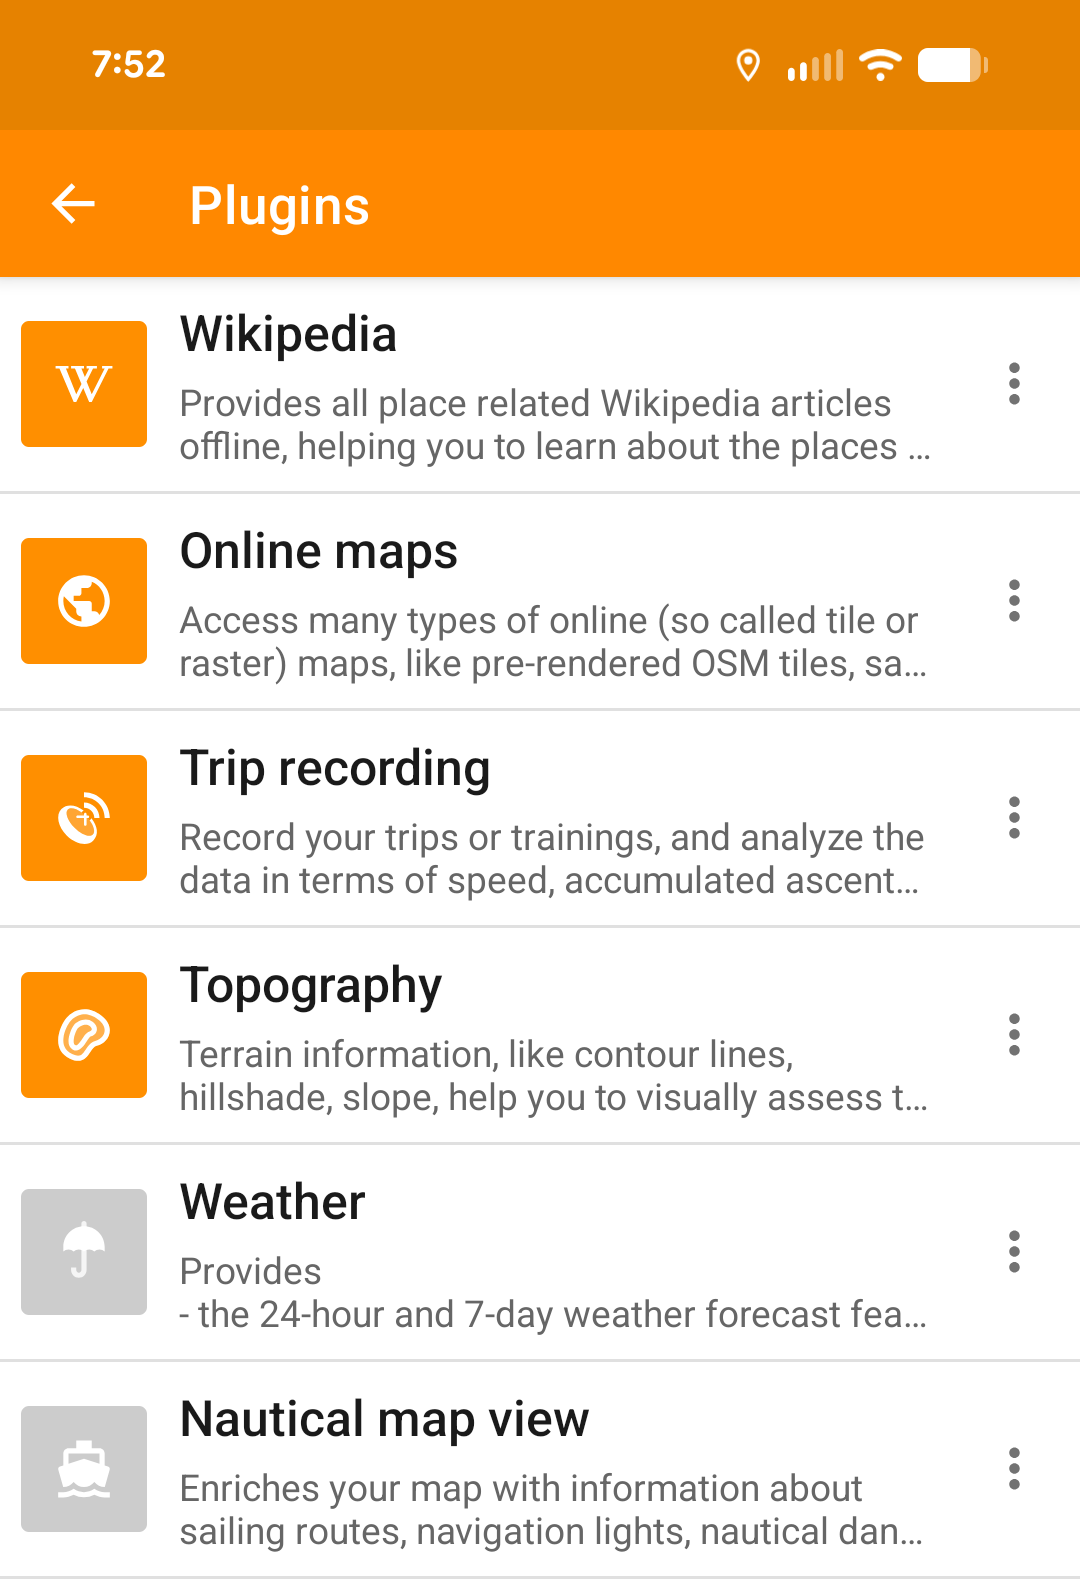
Open the OsmAnd menu, then under Plugins enable Online maps which will allow you to display mosaic tiles from Copernicus (as well of other sources). (OsmAnd help) You might as well also enable the Trip Recording plugin that will let you record your track as you skate.
Step 3: Add your Sentinel layers as Map Sources
Go to the OsmAnd menu –> Maps & Resources –> Local –> Map Sources
For each of the layers you want to display, go to the 3-dot menu and choose Add online source (docs).
Give your source a Name so you can identify the layer in the OsmAnd menus.
For the URL enter the following with <your-service-endpoint> replaced with the ID of your service endpoint (e.g. d02dd13e-a979-43e8-bca7-d2ed2cc37a08) and <layer-id> replaced with your layer ID (e.g. 2_FALSE_COLOR).
Template:
https://sh.dataspace.copernicus.eu/ogc/wmts/<your-service-endpoint>?&SERVICE=WMTS&VERSION=1.0.0&REQUEST=GetTile&FORMAT=image/png&LAYER=<layer-id>&TILEMATRIXSET=PopularWebMercator256&TILEMATRIX={0}&TILECOL={1}&TILEROW={2}Example:
https://sh.dataspace.copernicus.eu/ogc/wmts/d02dd13e-a979-43e8-bca7-d2ed2cc37a08?&SERVICE=WMTS&VERSION=1.0.0&REQUEST=GetTile&FORMAT=image/png&LAYER=2_FALSE_COLOR&TILEMATRIXSET=PopularWebMercator256&TILEMATRIX={0}&TILECOL={1}&TILEROW={2}
Set the Zoom Levels to 7-14 as Copernicus doesn’t serve tiles outside of this range and this will allow OsmAnd to over-zoom the tiles as needed.
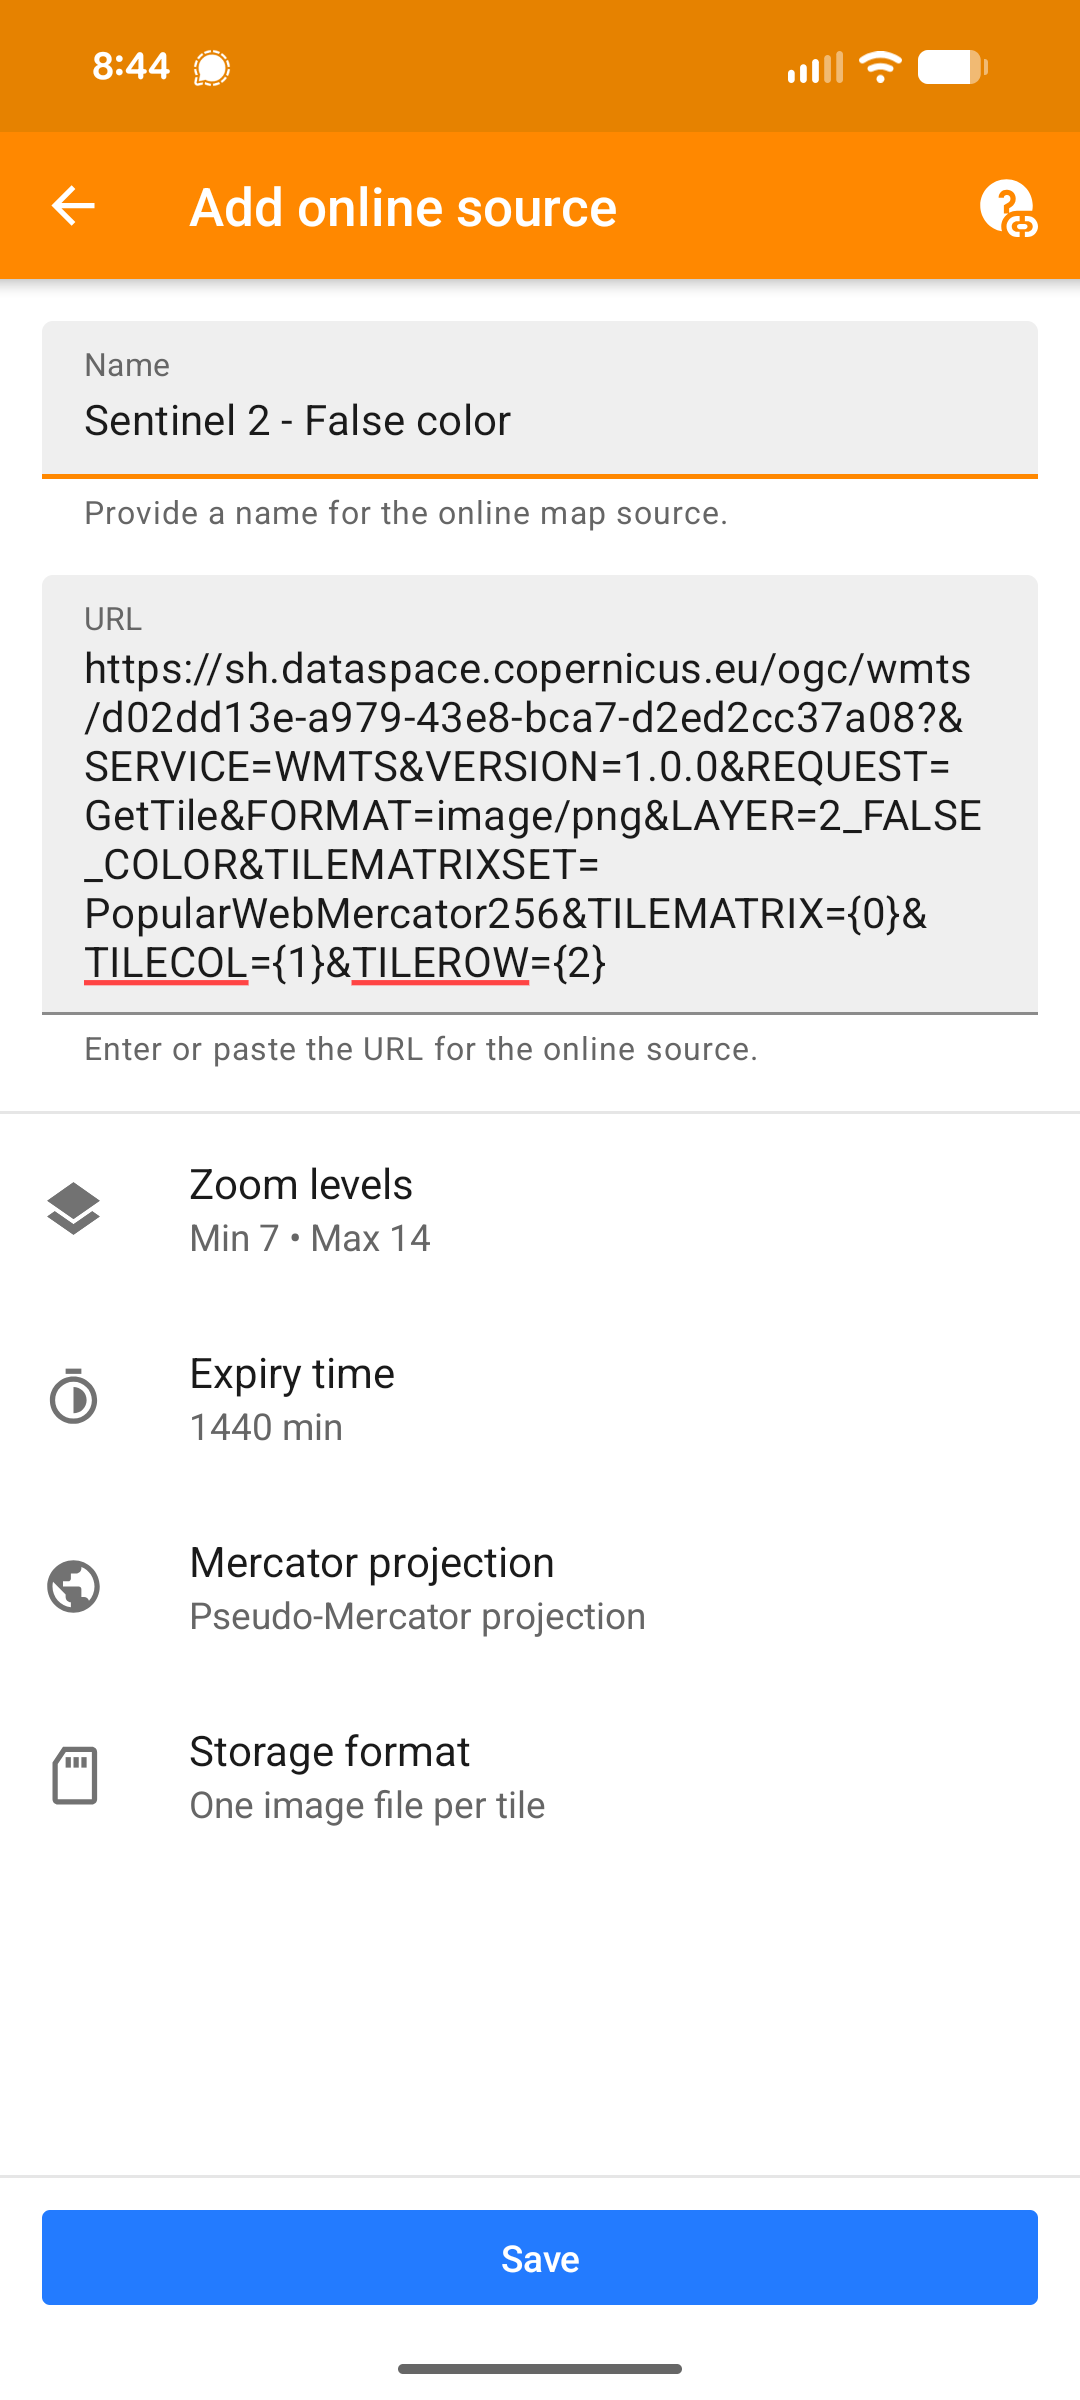
For Expiry time setting 1440 min (1 day) will tell OsmAnd to look for new tiles after 1 day. You could set this to a slightly lower number if you want OsmAnd to refresh tiles more frequently. Ideally you would have zoomed around and cached the tiles before you go out on the ice so that you don’t have to worry about them [slowly] loading while navigating. Likewise, if you will be exploring areas without mobile service, set a longer (or no) expiry time so that you don’t have to worry not having the tiles when you are out. You can always manually clear the cache of the source and re-download the tiles by zooming around.
The other settings you can leave as defaults
Step 4: Enable your Sentinel map source as an underlay
By adding an “Underlay” to your view, you show the satellite imagery with the rest of the map data over top.
Click on the Globe icon to configure the default display. Then click the 3-dots next to Underlay map…
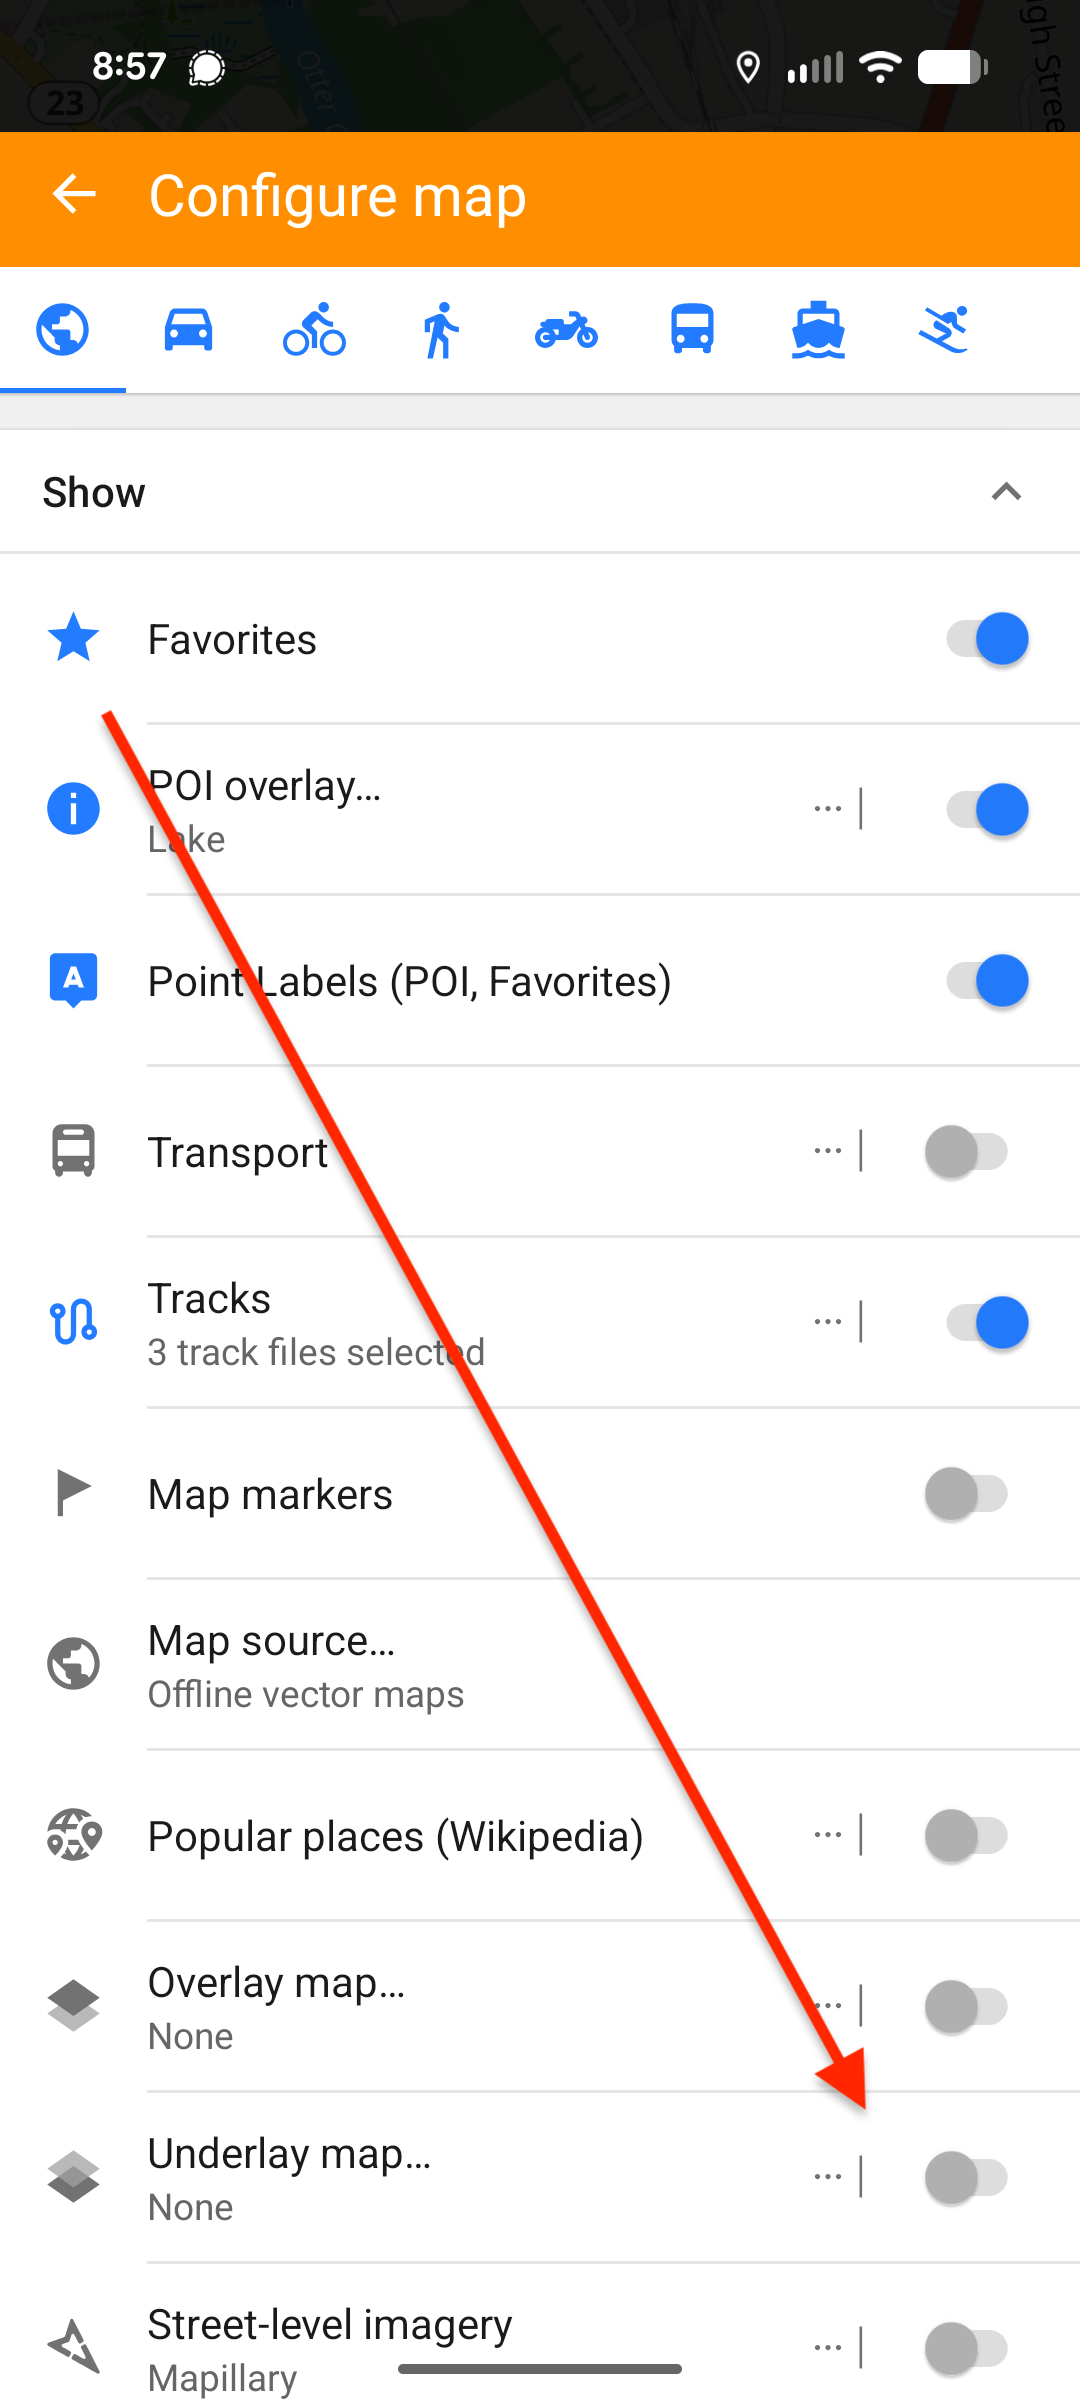
Select your Sentinel map source as the underlay map
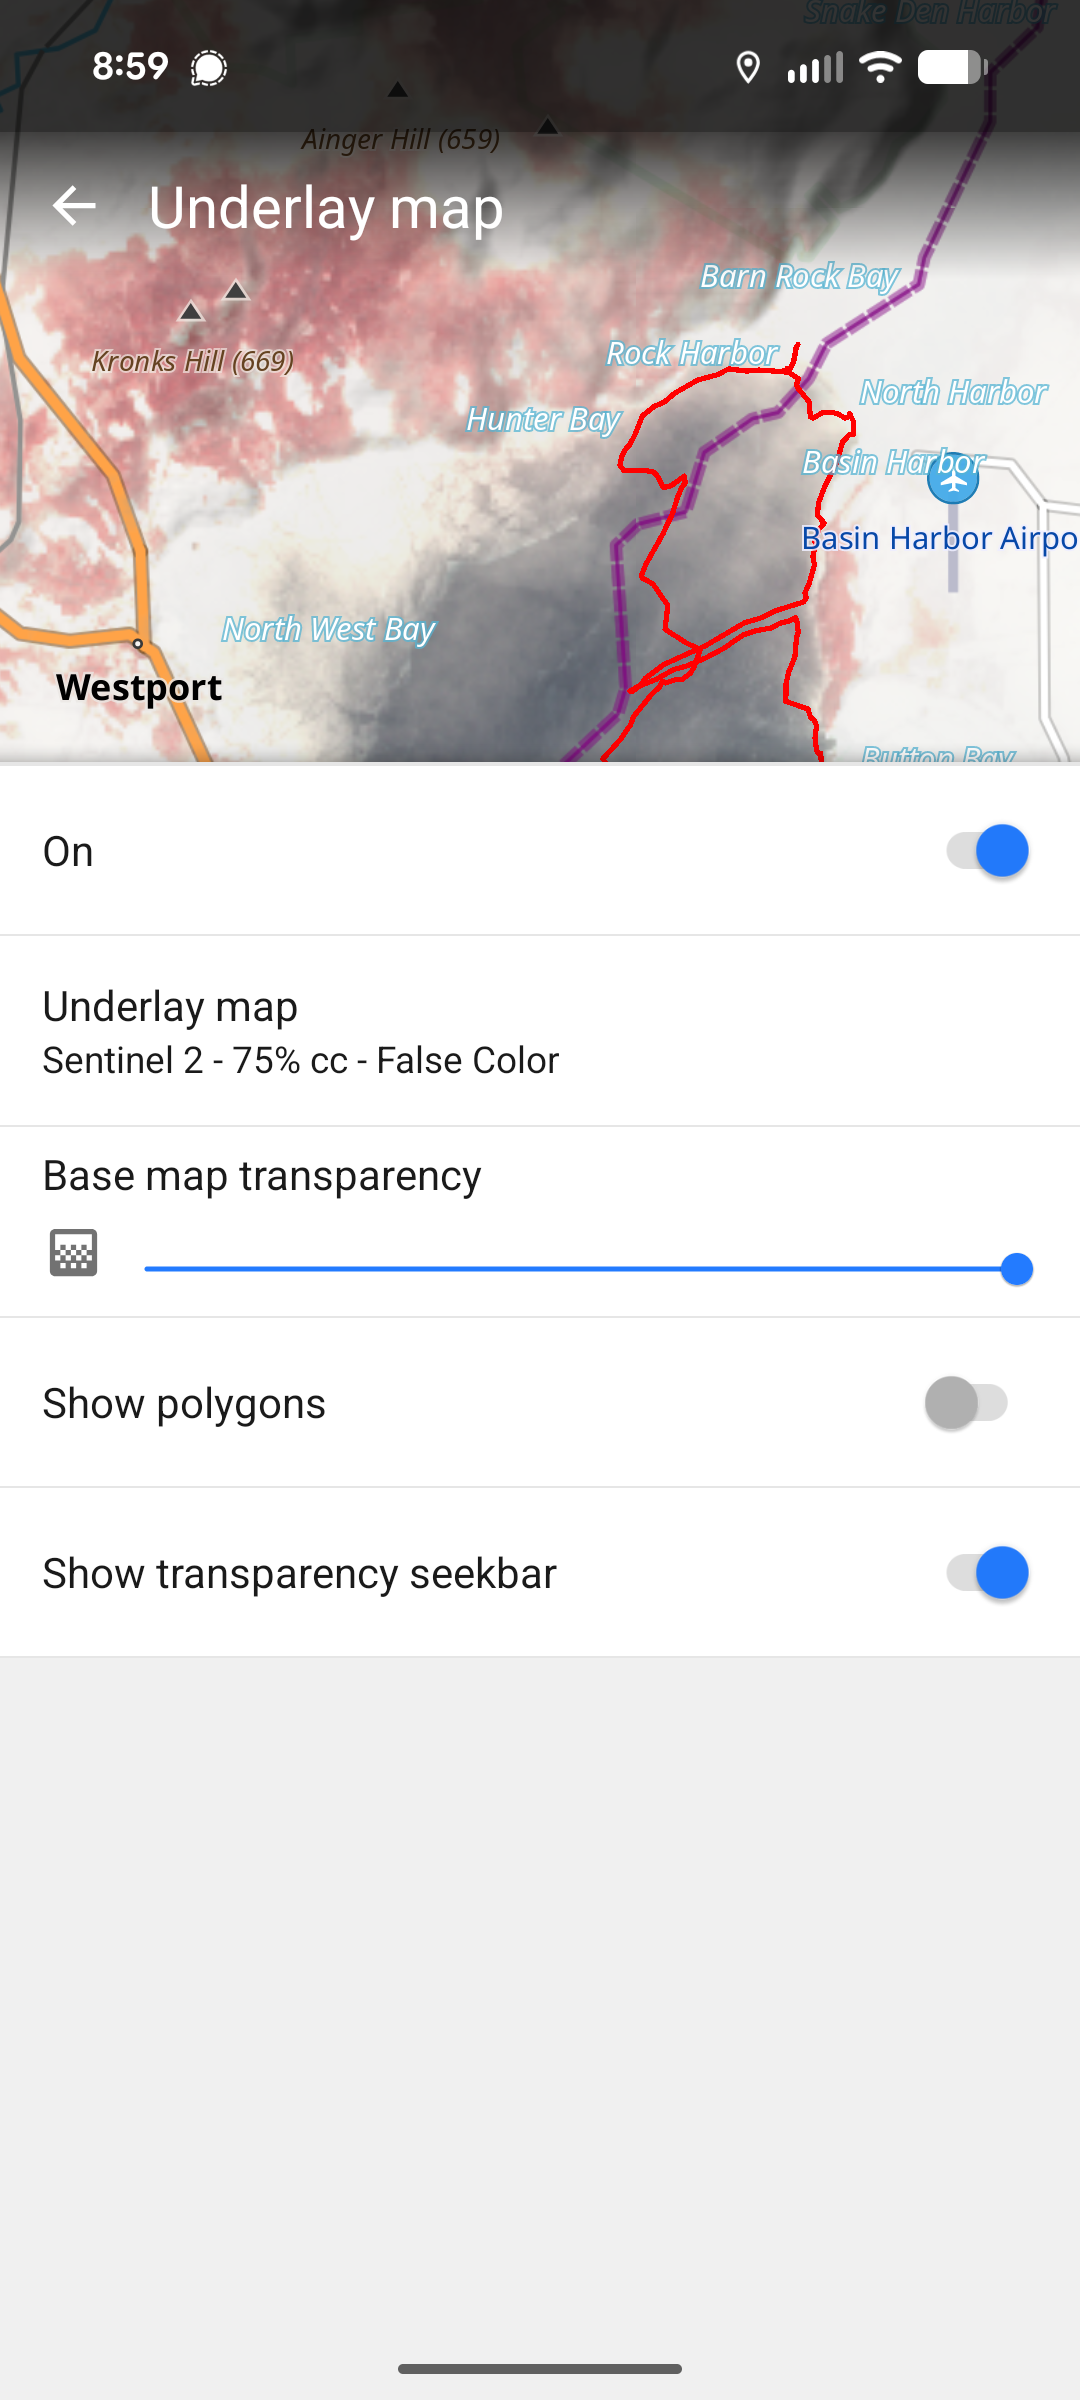
You can then go back to the main display and view the map with the Sentinel imagery as a background to the map data. If you are recording your track as you skate, you can see you track line tracing along as you go.
To go back to the default background, simply disable the underlay map.
Tips
From within OsmAnd there is no way to know what date the imagery is from. It’s easiest to compare what you see in OsmAnd with what you see as you change the date picker in the Copernicus browser to identify the date of the imagery.
To force a refresh of the imagery in OsmAnd go into the OsmAnd menu –> Maps & Resources –> Local –> Map Sources, click the menu for your source and choose Clear all tiles. You may need to quit and re-open OsmAnd for the new tiles to be fetched.
Hiding waterway=flowline
When you use an underlay map in OsmAnd there is currently a bug where “flowlines” (topological connections between inlets and outlets of a lake) are show. These are usually hidden by the lake areas, but the underlay map disables showing the lake areas.
For a partial fix to this bug, download this hide-flowline-default.render.xml file to your device, then open it with OsmAnd (docs). This style is the same as the current default, but with the flowlines hidden.